Free Access
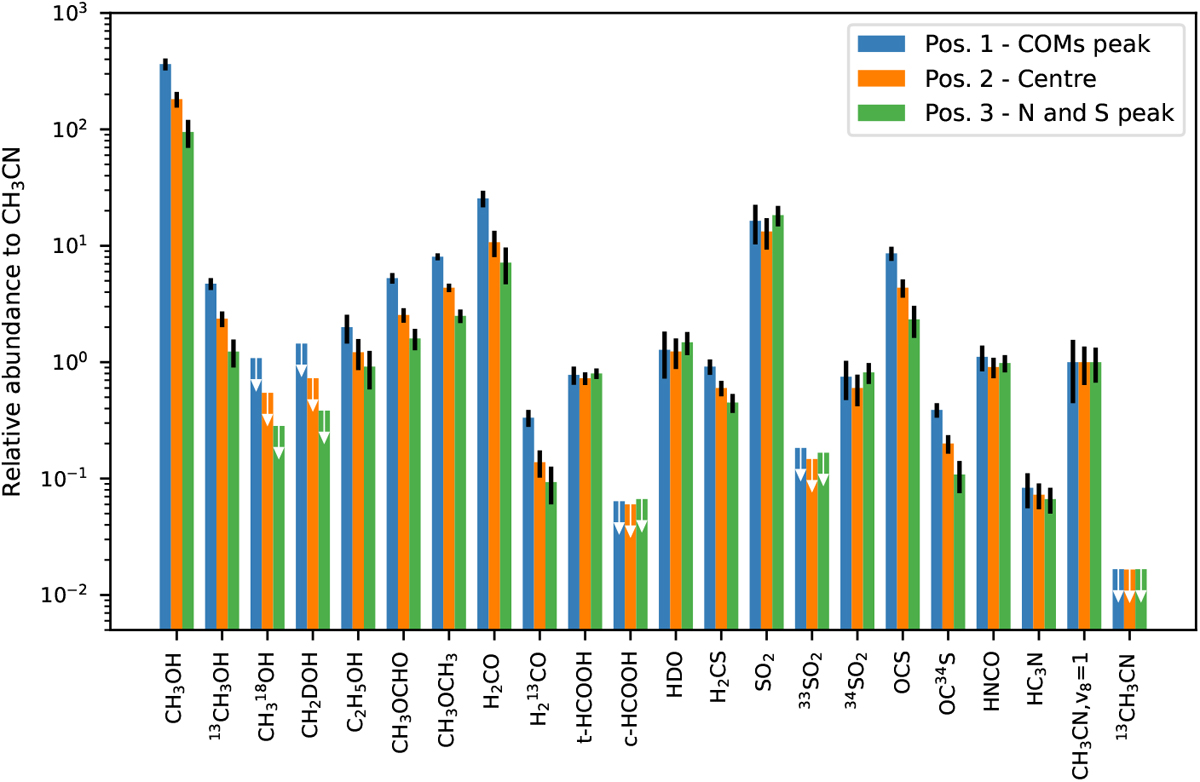
Fig. 20
Download original image
Relative abundances of each molecule relative to the column density of CH3CN at each respective position. The white arrows and black bars are as in Fig. 19.
Current usage metrics show cumulative count of Article Views (full-text article views including HTML views, PDF and ePub downloads, according to the available data) and Abstracts Views on Vision4Press platform.
Data correspond to usage on the plateform after 2015. The current usage metrics is available 48-96 hours after online publication and is updated daily on week days.
Initial download of the metrics may take a while.