Free Access
Fig. 17
Download original image
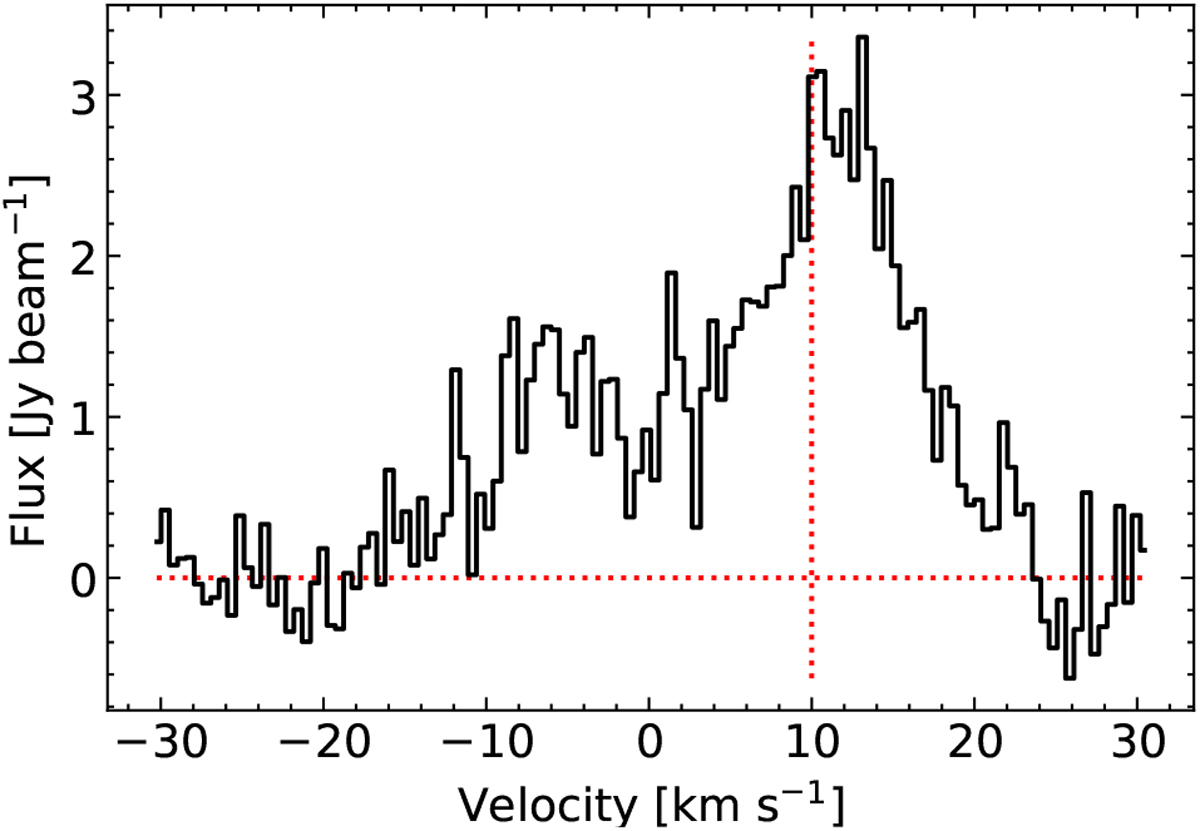
347.33 GHz SiO, J = 8 − 7 line, showingbroad emission, with a weak blueshifted component at − 6 km s−1. The horizontal red line represents the baseline, while the vertical line is the source velocity derived for MM1a from the line modelling in CASSIS, at 9.5 km s−1.
Current usage metrics show cumulative count of Article Views (full-text article views including HTML views, PDF and ePub downloads, according to the available data) and Abstracts Views on Vision4Press platform.
Data correspond to usage on the plateform after 2015. The current usage metrics is available 48-96 hours after online publication and is updated daily on week days.
Initial download of the metrics may take a while.