Fig. 11
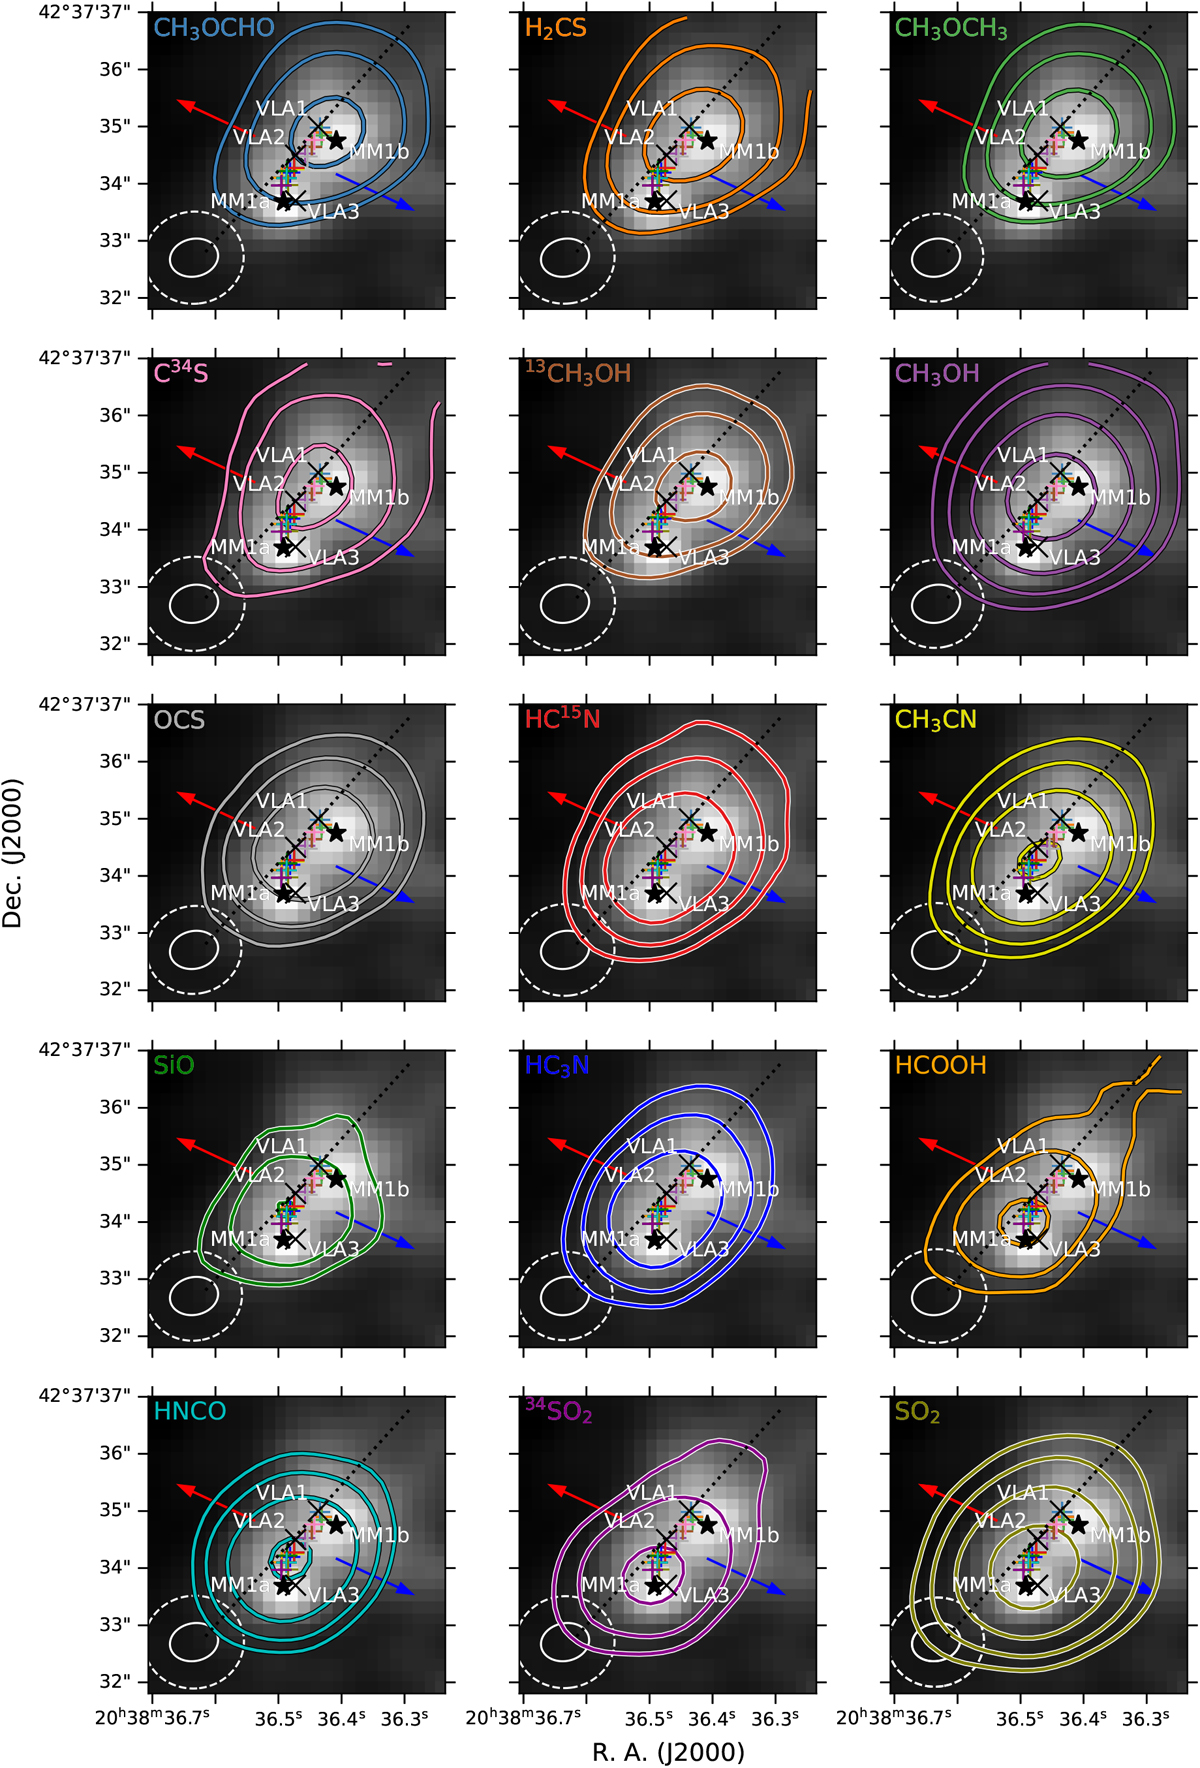
Download original image
N30 molecules in contours over continuum in grey-scale. The peak positions of the 2D Gaussian fits to the continuum cores, MM1a and MM1b, are represented with black stars, while the VLAsources are shown with crosses. The molecular peak positions are marked with coloured plus symbols of the same colour as the respective molecule contour plot. The contour levels are 3σ, 6σ, 12σ, and 24σ. The beam sizes are represented by the inner and outer ellipses, with inner representing the continuum, with dimensions as in Fig. 1, and the outer, the beam size of the molecular emission map, which have dimensions of ~ 1′′.65 × 1′′.55, and position angle of ~ 11° for all molecules. The dotted line represents the red- and blueshifted H2CO emission, while the arrows represent large-scale CO emission. The panels are sorted according to position of the peak emission, from top to bottom, and left to right.
Current usage metrics show cumulative count of Article Views (full-text article views including HTML views, PDF and ePub downloads, according to the available data) and Abstracts Views on Vision4Press platform.
Data correspond to usage on the plateform after 2015. The current usage metrics is available 48-96 hours after online publication and is updated daily on week days.
Initial download of the metrics may take a while.