Free Access
Fig. 10
Download original image
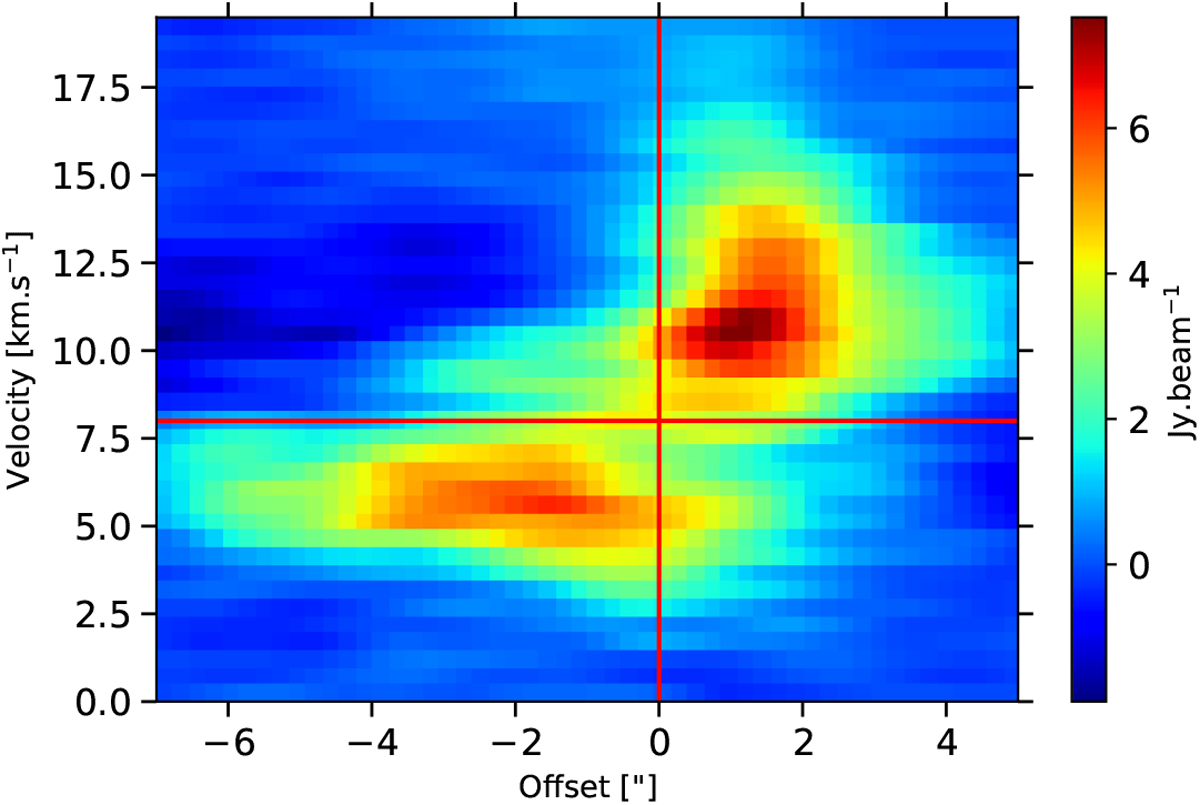
Position–velocity map of the 342.88 GHz CS J = 7−6 line. As with the H2CO map, the emission at larger velocity is concentrated close to the centre of the emission (between the red- and blueshifted peaks), whereas the emission close to the systemic velocity extends out to larger spacial scales.
Current usage metrics show cumulative count of Article Views (full-text article views including HTML views, PDF and ePub downloads, according to the available data) and Abstracts Views on Vision4Press platform.
Data correspond to usage on the plateform after 2015. The current usage metrics is available 48-96 hours after online publication and is updated daily on week days.
Initial download of the metrics may take a while.