Free Access
Fig. 3
Download original image
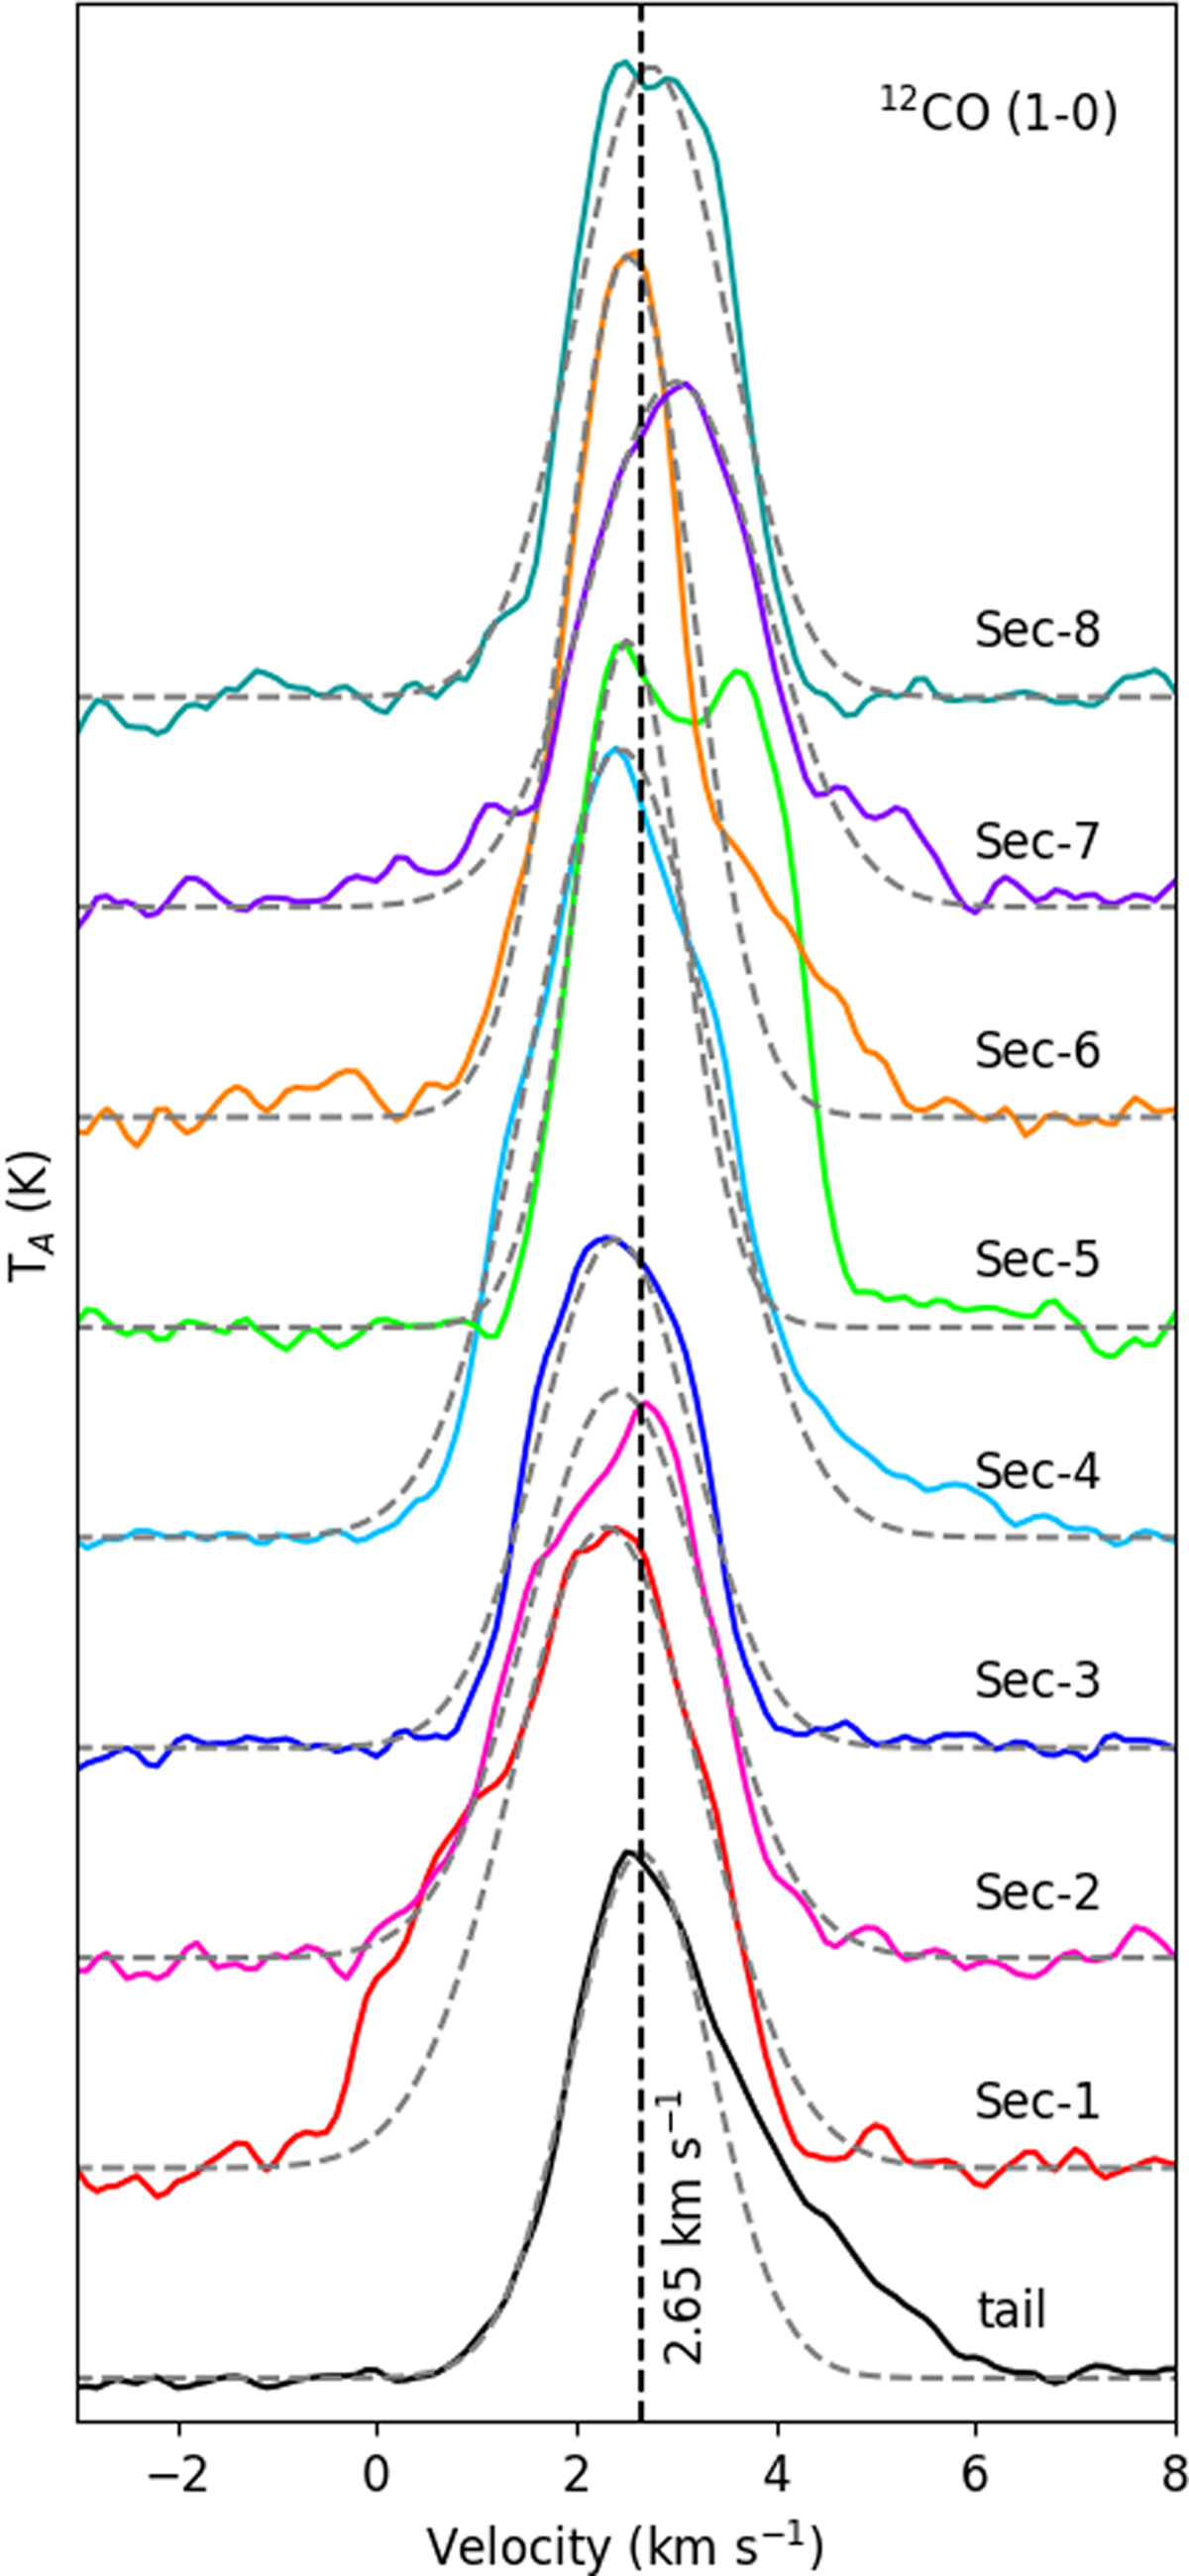
Average 12CO (J = 1–0) line profiles for the eight sectors made toward the head. The average 12CO (J = 1–0) line profile for the tail region is shown in black. The Vlsr =2.65 km s−1 is shown using a dashed vertical line. The dashed curves are the Gaussian fitted lines used to obtain the ΔV.
Current usage metrics show cumulative count of Article Views (full-text article views including HTML views, PDF and ePub downloads, according to the available data) and Abstracts Views on Vision4Press platform.
Data correspond to usage on the plateform after 2015. The current usage metrics is available 48-96 hours after online publication and is updated daily on week days.
Initial download of the metrics may take a while.