Fig. 2
Download original image
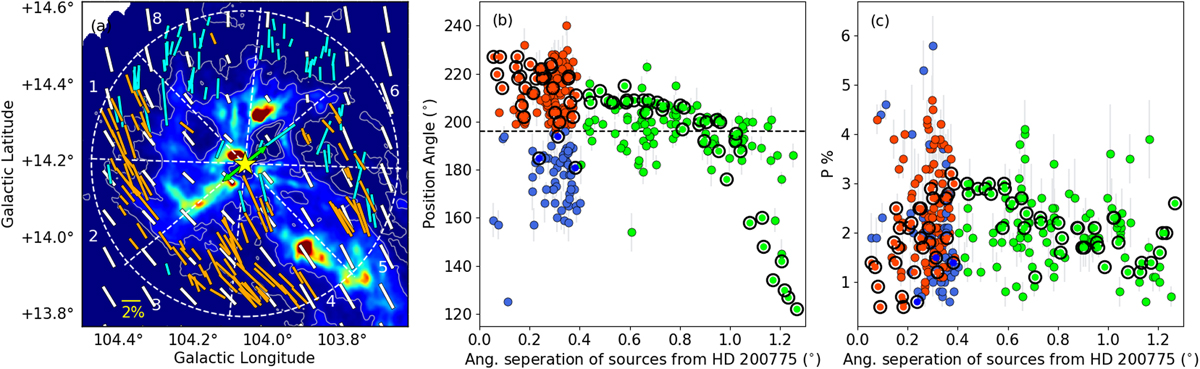
Variation in the projected magnetic field geometry toward the L1172/1174 cloud complex. (a) Optical R-band and Planck polarimetric results overplotted on Herschel column density map. Location of HD 200775 (yellow star) is also shown. The green colored arrows imply the directions of outflow from HD 200775. The eight sectors are indicated using dashed white lines and also marked. Orange lines indicate the polarization measurements in the R band with θR ≥ 196° and cyan lines represent the same with θR < 196°. White lines represent Planck polarimetric results with 90° rotation. A polarization vector corresponding to 2% is shown for reference. (b) Variation in the θR of the sources with respect to the angular separation from HD 200775. Upto 0.4° (Sects. 1–8) there are sources located toward the head region with two sets of distribution of position angles ~211° (red filled circles, shown in orange lines in (a)) and ~179° (blue filled circles, shown in cyan lines in (a)). The green filled circles are the sources distributed toward the tail region. The dashed horizontal line indicates the mean θR value (~ 196°) of the same sources. Position angles obtained from Planck observations are shown using thick open black circles (shown in white lines in (a)). (c) Variation in the PR % and PP % with respectto the angular separation from HD 200775. The symbols represent the same as described in panel b.
Current usage metrics show cumulative count of Article Views (full-text article views including HTML views, PDF and ePub downloads, according to the available data) and Abstracts Views on Vision4Press platform.
Data correspond to usage on the plateform after 2015. The current usage metrics is available 48-96 hours after online publication and is updated daily on week days.
Initial download of the metrics may take a while.