Fig. 4.
Download original image
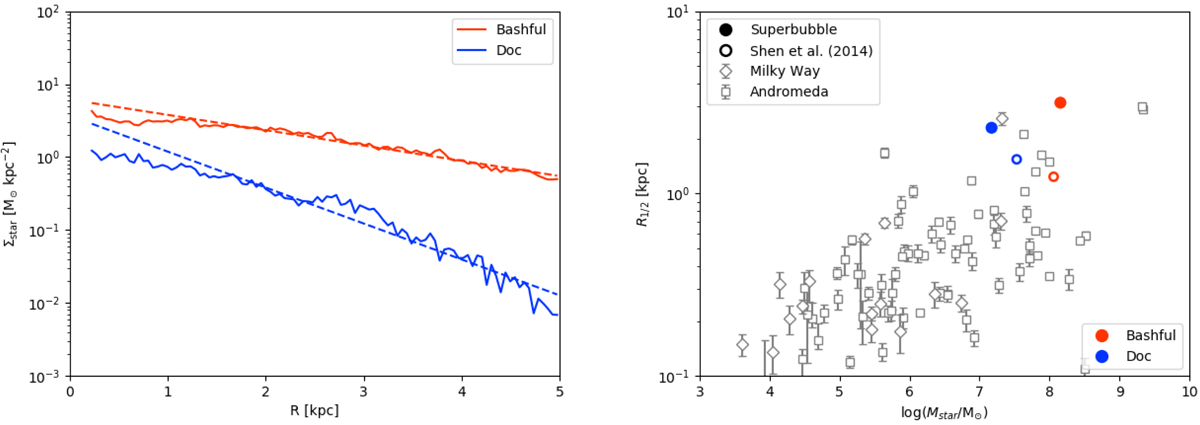
Left panel: 1D line-of-sight stellar surface density profiles of Bashful (red) and Doc (blue), represented by the solid lines. The dashed lines show the exponential fit of their stellar discs, I(R > 1 kpc) = Idexp(−R/Rd), with a characteristic scale of Rd = (2.07 ± 0.036) kpc for Bashful and Rd = (0.88 ± 0.023) kpc for Doc. Right panel: stellar half-light radius–mass relation of the simulated dwarfs at z = 0. The filled coloured circles represent Bashful (red) and Doc (blue) in our simulation. The empty circles with coloured edges correspond to Bashful (red) and Doc (blue) simulated in Shen et al. (2014), with the blastwave feedback model. The other empty symbols represent satellite galaxies of the Milky Way (diamonds) and Andromeda (squares), from the original sample of Local Group galaxies published by McConnachie (2012).
Current usage metrics show cumulative count of Article Views (full-text article views including HTML views, PDF and ePub downloads, according to the available data) and Abstracts Views on Vision4Press platform.
Data correspond to usage on the plateform after 2015. The current usage metrics is available 48-96 hours after online publication and is updated daily on week days.
Initial download of the metrics may take a while.