Free Access
Fig. 11.
Download original image
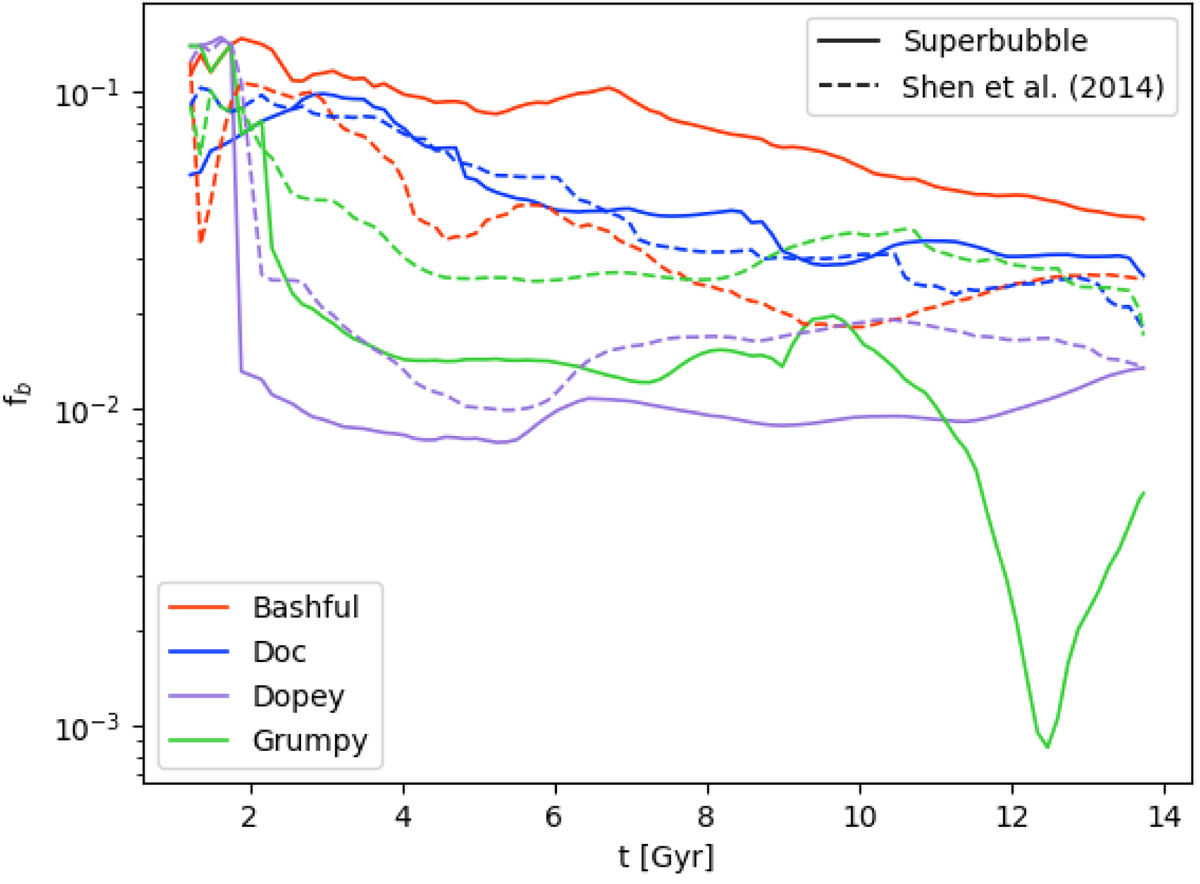
Temporal evolution of the baryonic fraction fb ≡ (M* + Mgas)/Mvir of Bashful (red), Doc (blue), Dopey (purple) and Grumpy (green). The solid lines correspond to the dwarfs simulated with superbubble feedback, while the dashed lines correspond to the dwarfs simulated in Shen et al. (2014) with blastwave feedback.
Current usage metrics show cumulative count of Article Views (full-text article views including HTML views, PDF and ePub downloads, according to the available data) and Abstracts Views on Vision4Press platform.
Data correspond to usage on the plateform after 2015. The current usage metrics is available 48-96 hours after online publication and is updated daily on week days.
Initial download of the metrics may take a while.