Free Access
Fig. 9.
Download original image
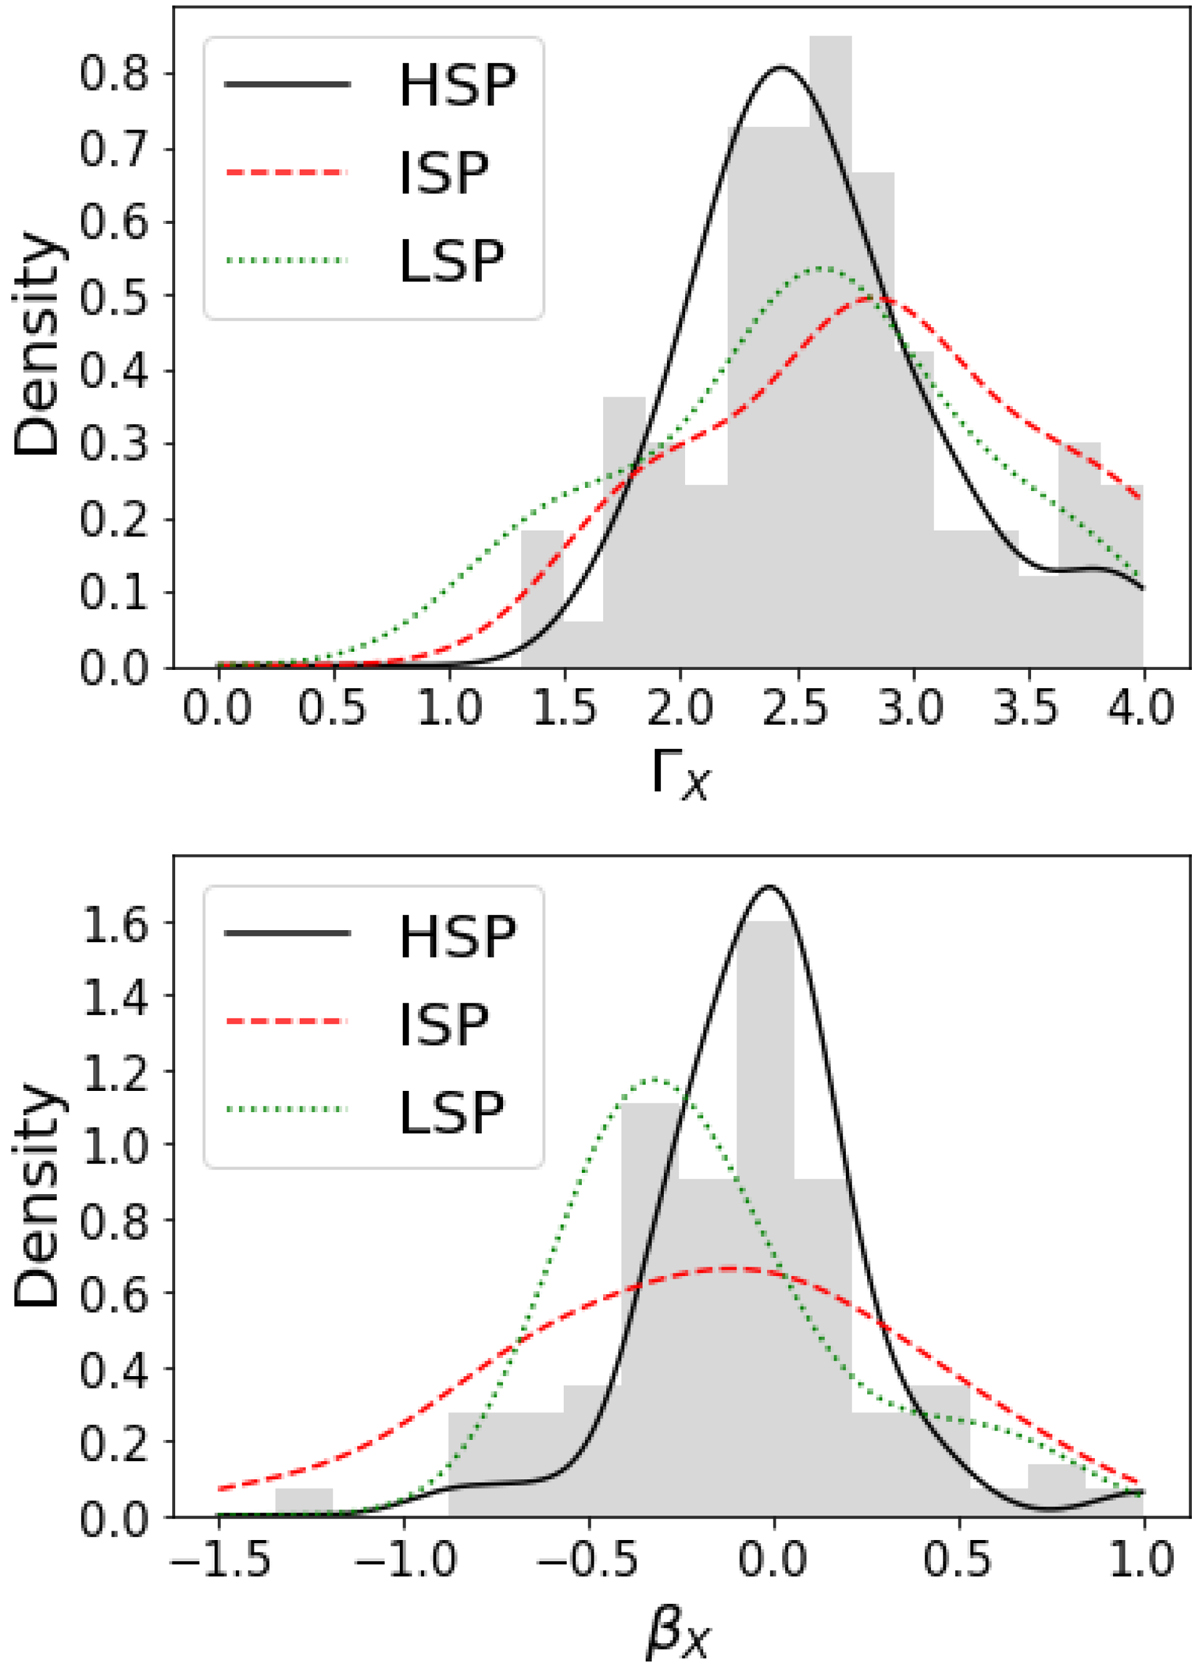
Top: log parabola NH free model photon index ΓX distribution for the non-biased sample of BL Lacs (grey bars), and curves showing the KDE for the subpopulations HSP (black solid line), ISP (dashed red line), and LSP (green dotted line). Bottom: idem βX distribution.
Current usage metrics show cumulative count of Article Views (full-text article views including HTML views, PDF and ePub downloads, according to the available data) and Abstracts Views on Vision4Press platform.
Data correspond to usage on the plateform after 2015. The current usage metrics is available 48-96 hours after online publication and is updated daily on week days.
Initial download of the metrics may take a while.