Fig. 7.
Download original image
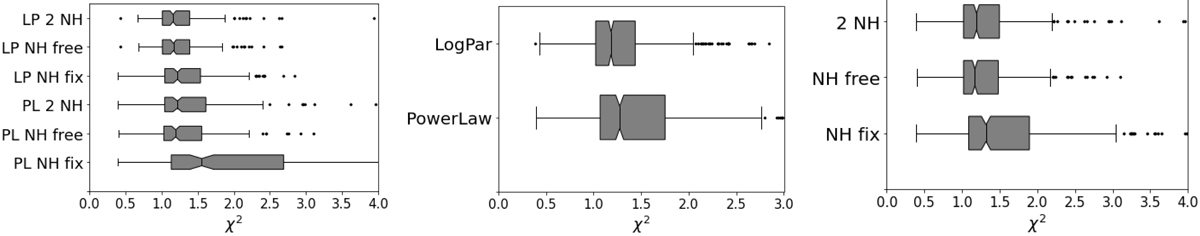
![]() box plots. In each panel, the median value for each model is depicted by a vertical line inside the box, the grey boxes range from the first quantile (Q1) to the third quantile (Q3), the notch around the median indicates the confidence interval (1.5 × (Q3 − Q1)), the lines extending horizontally from the boxes (whiskers) indicate the minimum and maximum value after removing outliers. Outliers are plotted as stars. Left: six models from top to bottom: log parabola with a combination of NH, Gal and NH, z, NH free and NH fixed to NH, Gal, power law with a combination of NH, Gal and NH, z, NH free and NH fixed to NH, Gal. Middle: From top to bottom: log parabola and power law models. Right: From top to bottom: models with combination of NH, Gal and NH, z, NH free, and NH fixed to NH, Gal.
box plots. In each panel, the median value for each model is depicted by a vertical line inside the box, the grey boxes range from the first quantile (Q1) to the third quantile (Q3), the notch around the median indicates the confidence interval (1.5 × (Q3 − Q1)), the lines extending horizontally from the boxes (whiskers) indicate the minimum and maximum value after removing outliers. Outliers are plotted as stars. Left: six models from top to bottom: log parabola with a combination of NH, Gal and NH, z, NH free and NH fixed to NH, Gal, power law with a combination of NH, Gal and NH, z, NH free and NH fixed to NH, Gal. Middle: From top to bottom: log parabola and power law models. Right: From top to bottom: models with combination of NH, Gal and NH, z, NH free, and NH fixed to NH, Gal.
Current usage metrics show cumulative count of Article Views (full-text article views including HTML views, PDF and ePub downloads, according to the available data) and Abstracts Views on Vision4Press platform.
Data correspond to usage on the plateform after 2015. The current usage metrics is available 48-96 hours after online publication and is updated daily on week days.
Initial download of the metrics may take a while.