Free Access
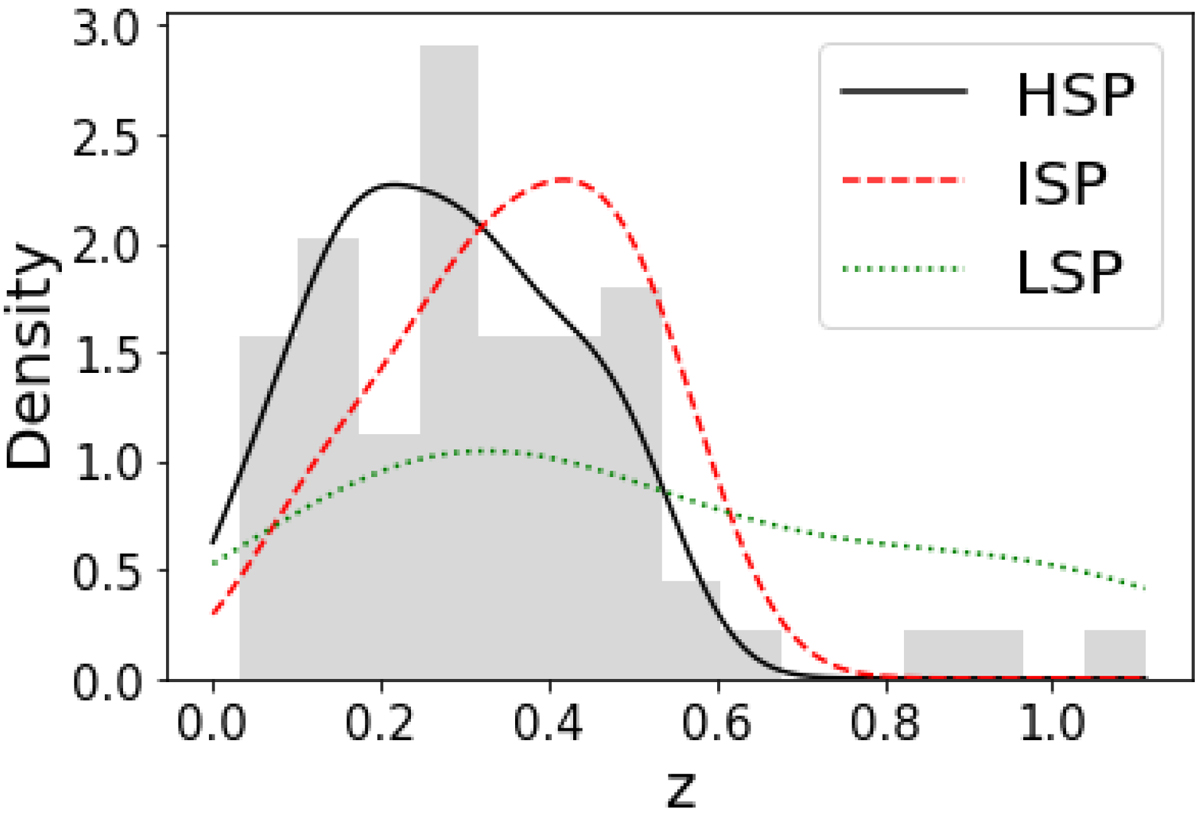
Fig. 6.
Download original image
Redshift distribution for the sources in the XMM–Newton BL Lac catalogue. Grey bars represent all BL Lacs for which the redshift is known (60% of the total sample), while curves represent the KDE curves for the subpopulations HSP (solid black), ISP (dashed red), and LSP (dotted green).
Current usage metrics show cumulative count of Article Views (full-text article views including HTML views, PDF and ePub downloads, according to the available data) and Abstracts Views on Vision4Press platform.
Data correspond to usage on the plateform after 2015. The current usage metrics is available 48-96 hours after online publication and is updated daily on week days.
Initial download of the metrics may take a while.