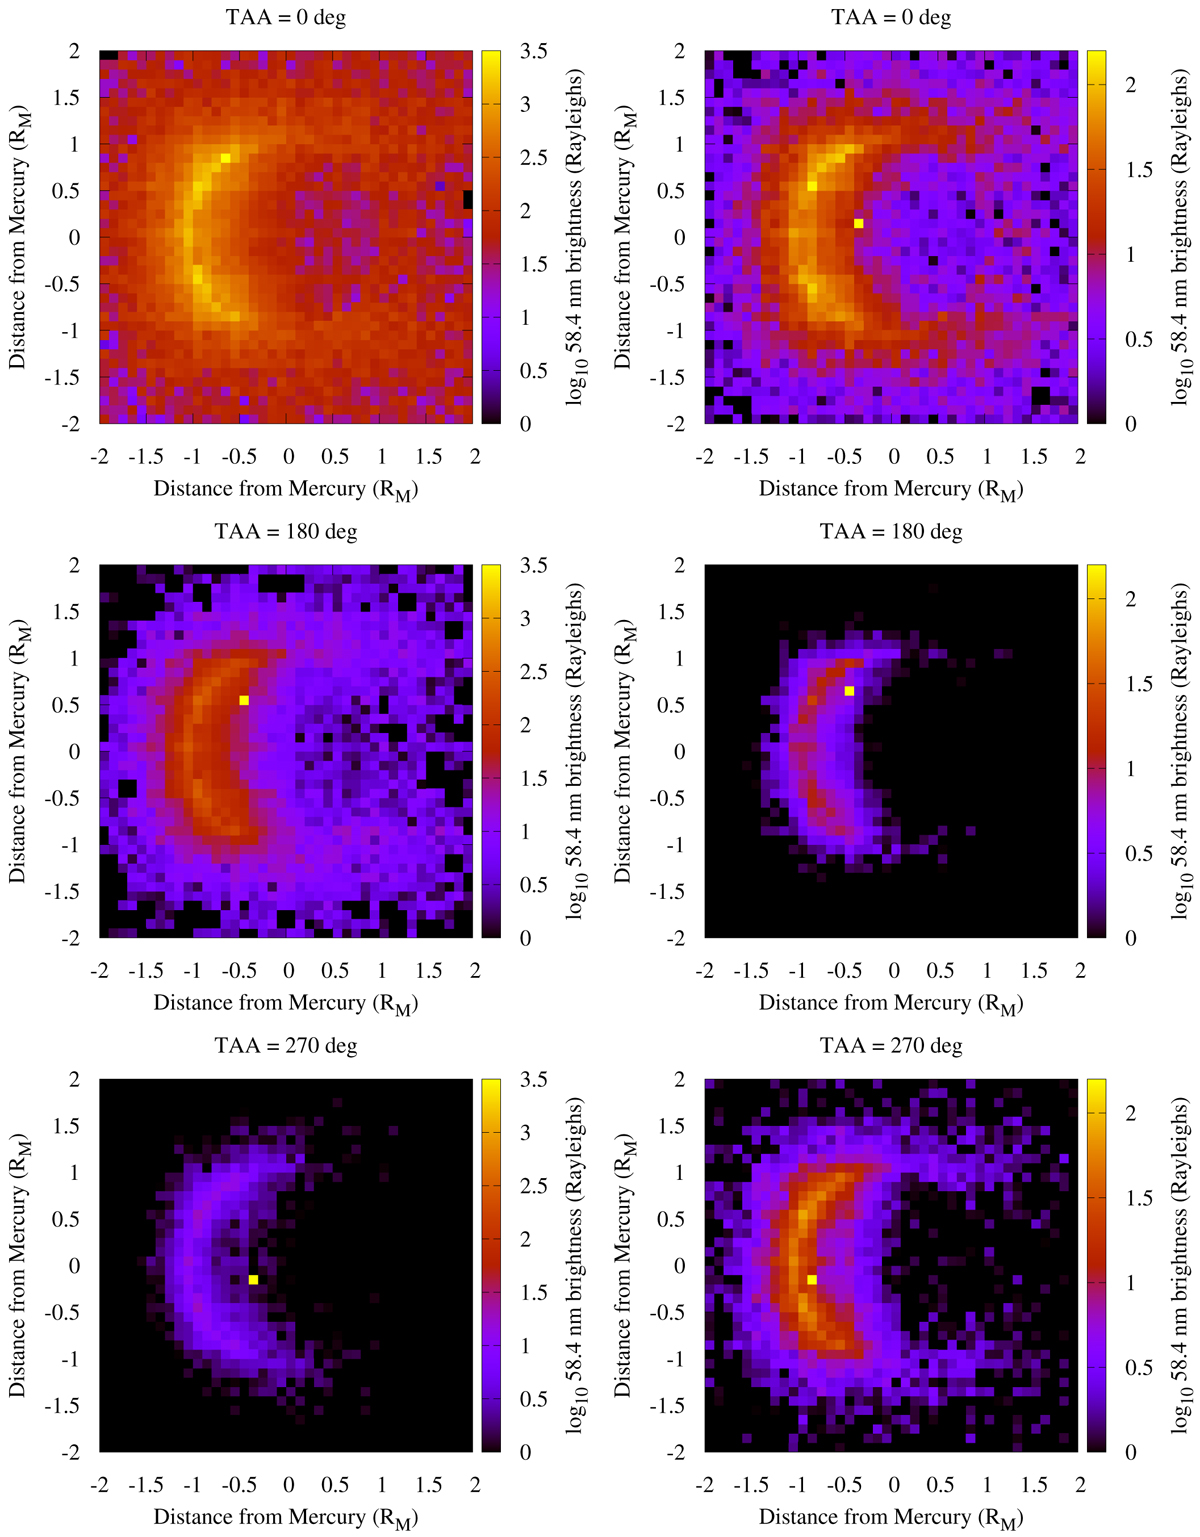
Fig. 4.
Download original image
Two dimensional brightness distributions of the He I 58.4 nm emission of Mercury at three TAAs (0, 180, and 270 degrees) reproduced by model simulation. Horizontal and vertical axes correspond to the x and z directions shown in Fig. 1. The brightness was integrated in each 0.1 RM × 0.1RM box. The line width of the solar He I 58.4 nm emission is assumed to be 0.0016 nm (left column, Kumar et al. 1973) and 0.015 nm (right column, Wilhelm et al. 1997). The horizontal axis is the distance from Mercury’s center along the Sun-Mercury line, and the vertical axis is along Mercury’s rotation axis. The brightest pixels were artificially added to maintain the same color scale for the images within one column.
Current usage metrics show cumulative count of Article Views (full-text article views including HTML views, PDF and ePub downloads, according to the available data) and Abstracts Views on Vision4Press platform.
Data correspond to usage on the plateform after 2015. The current usage metrics is available 48-96 hours after online publication and is updated daily on week days.
Initial download of the metrics may take a while.