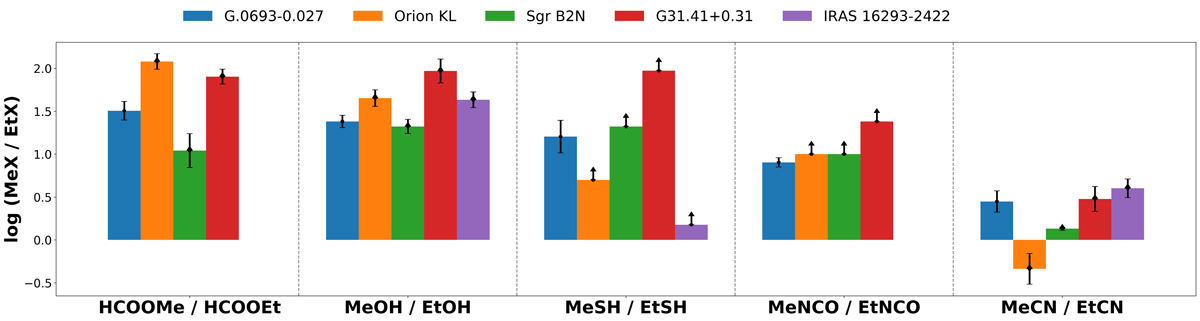
Fig. 4.
Download original image
Comparison of MeX/EtX ratios among different regions of the ISM, where X = HCOO, OH, SH, NCO, and CN (from right to left). The data have been taken from the following: Zeng et al. (2018), Rodríguez-Almeida et al. (2021), and this work for G+0.693-0.027; Kolesniková et al. (2014), López et al. (2014), Tercero et al. (2015), and Kolesniková et al. (2018) for Orion KL; Belloche et al. (2009) and Kolesniková et al. (2018) for Sgr B2N; Mininni et al. (2020), Colzi et al. (2021), and Mininni et al. (in prep.) for G31.41+0.31; and Drozdovskaya et al. (2019) for IRAS 16293-2422.
Current usage metrics show cumulative count of Article Views (full-text article views including HTML views, PDF and ePub downloads, according to the available data) and Abstracts Views on Vision4Press platform.
Data correspond to usage on the plateform after 2015. The current usage metrics is available 48-96 hours after online publication and is updated daily on week days.
Initial download of the metrics may take a while.