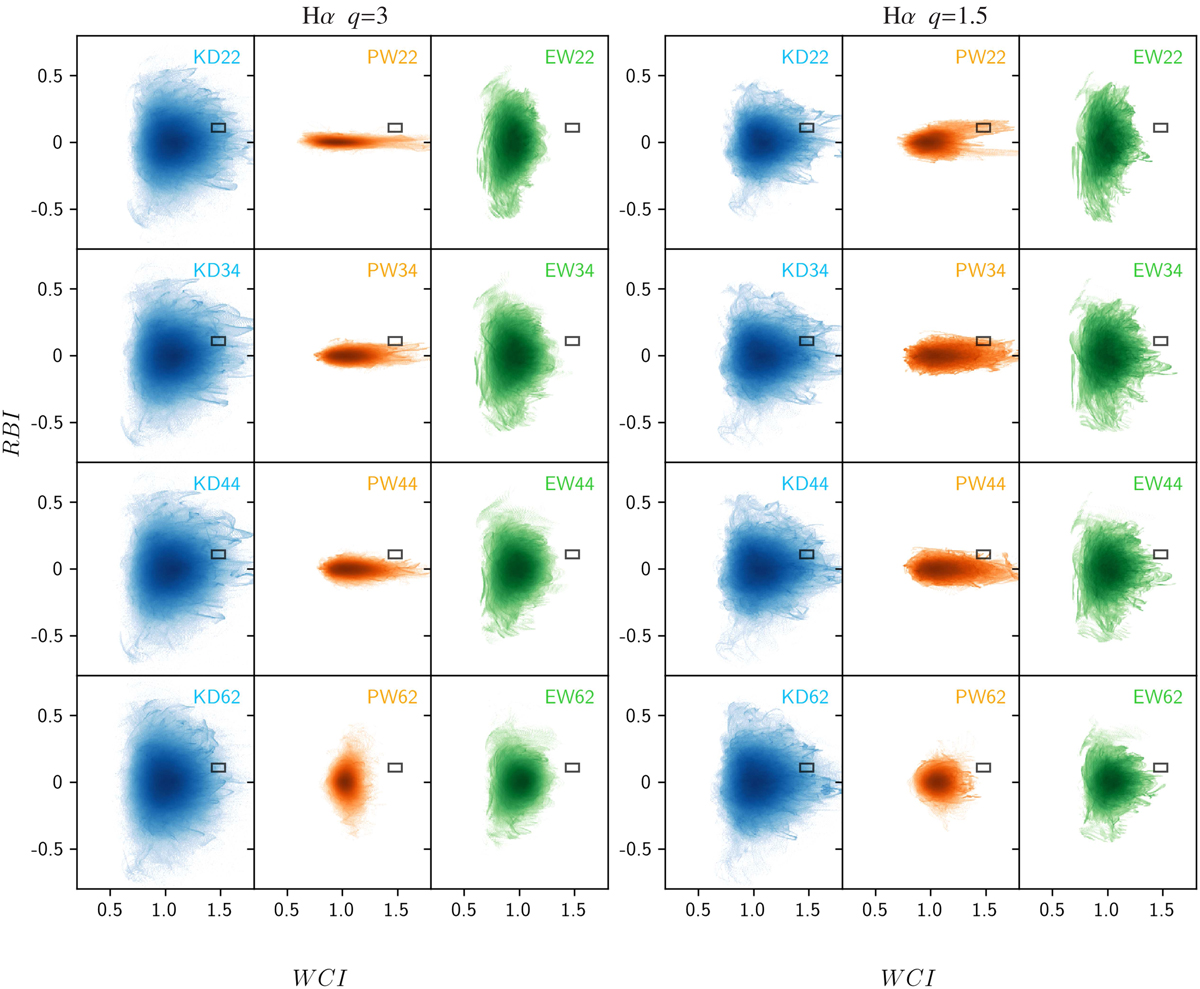
Fig. 3.
Download original image
Two-dimensional histograms of simulated WCI, RBI for the Hα emission line. Same as Fig. 2, but only the models that reproduce the μcont and μBLR values measured for the Hα emission line are shown, i.e., 2.2 ≤ μcont ≤ 2.7 and 2.09 ≤ μBLR ≤ 2.35 (Table 1). The WCI and RBI values measured for Hα are plotted with their uncertainties as a small rectangle superimposed on the simulated WCI, RBI distributions.
Current usage metrics show cumulative count of Article Views (full-text article views including HTML views, PDF and ePub downloads, according to the available data) and Abstracts Views on Vision4Press platform.
Data correspond to usage on the plateform after 2015. The current usage metrics is available 48-96 hours after online publication and is updated daily on week days.
Initial download of the metrics may take a while.