Fig. 1.
Download original image
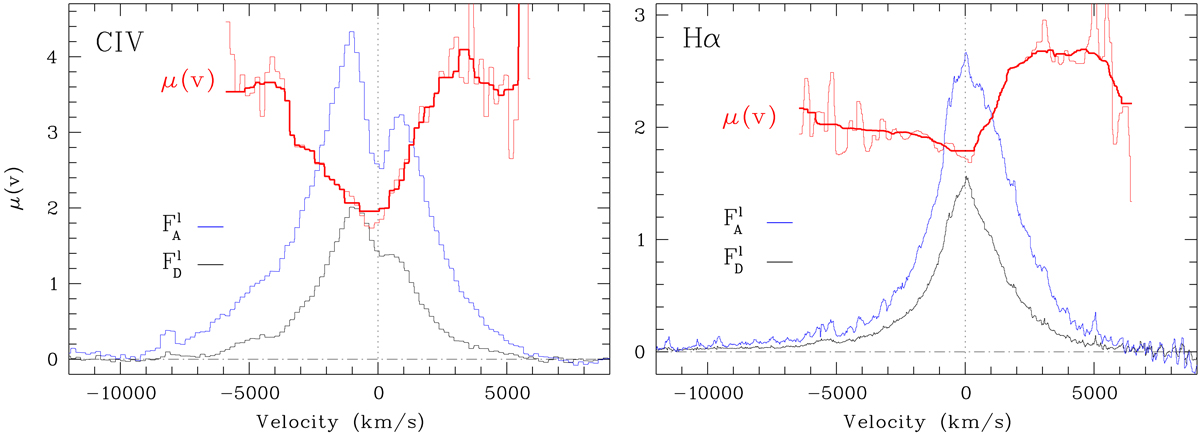
Flux density ratio ![]() , where M = 1, is illustrated as a function of the Doppler velocity for the C IVλ1549 Å and Hα emission lines observed in the lensed quasar Q2237+0305 (red lines). μ(v) is shown after smoothing the line profiles with a 220 km s−1 wide median filter and a 1500 km s−1 wide median filter (thin and thick red lines, respectively). Outside the displayed velocity range, μ(v) becomes unreliable due to the low line fluxes. The continuum-subtracted spectra of images A and D (
, where M = 1, is illustrated as a function of the Doppler velocity for the C IVλ1549 Å and Hα emission lines observed in the lensed quasar Q2237+0305 (red lines). μ(v) is shown after smoothing the line profiles with a 220 km s−1 wide median filter and a 1500 km s−1 wide median filter (thin and thick red lines, respectively). Outside the displayed velocity range, μ(v) becomes unreliable due to the low line fluxes. The continuum-subtracted spectra of images A and D (![]() and
and ![]() , respectively) are superimposed for comparison (blue and black lines, in arbitrary units).
, respectively) are superimposed for comparison (blue and black lines, in arbitrary units).
Current usage metrics show cumulative count of Article Views (full-text article views including HTML views, PDF and ePub downloads, according to the available data) and Abstracts Views on Vision4Press platform.
Data correspond to usage on the plateform after 2015. The current usage metrics is available 48-96 hours after online publication and is updated daily on week days.
Initial download of the metrics may take a while.