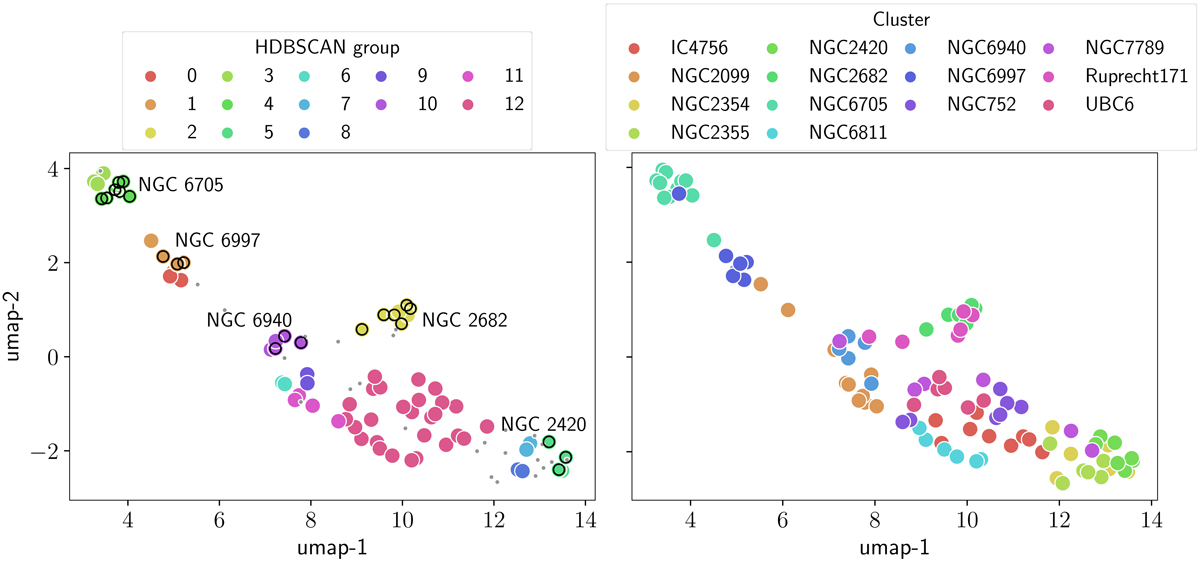
Fig. 6.
Download original image
Similar to Fig. 5 but only using clusters with at least 6 members in the high precision sample. UMAP projections of the stars colouring the real clusters (right), and the groups found by HDBSCAN (left). The stars highlighted in black circles are those recovered in a group with at least 40% homogeneity and completeness (those in boldface in Table 3).
Current usage metrics show cumulative count of Article Views (full-text article views including HTML views, PDF and ePub downloads, according to the available data) and Abstracts Views on Vision4Press platform.
Data correspond to usage on the plateform after 2015. The current usage metrics is available 48-96 hours after online publication and is updated daily on week days.
Initial download of the metrics may take a while.