Open Access
Fig. 3.
Download original image
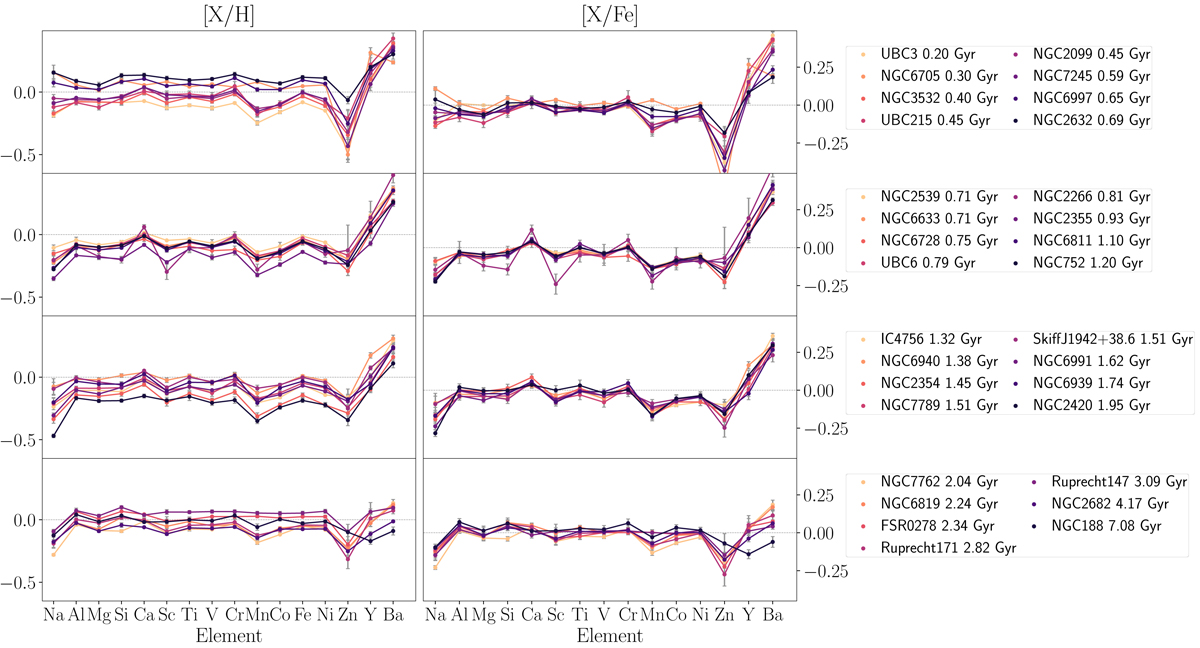
Mean [X/H] (left) and [X/Fe] (right) abundances of the sample of 31 clusters in the high-precision sample. Clusters are sorted by age (increasing downwards) in the different panels. They are coloured by age from young (yellow) to old (black).
Current usage metrics show cumulative count of Article Views (full-text article views including HTML views, PDF and ePub downloads, according to the available data) and Abstracts Views on Vision4Press platform.
Data correspond to usage on the plateform after 2015. The current usage metrics is available 48-96 hours after online publication and is updated daily on week days.
Initial download of the metrics may take a while.