Fig. A.3
Download original image
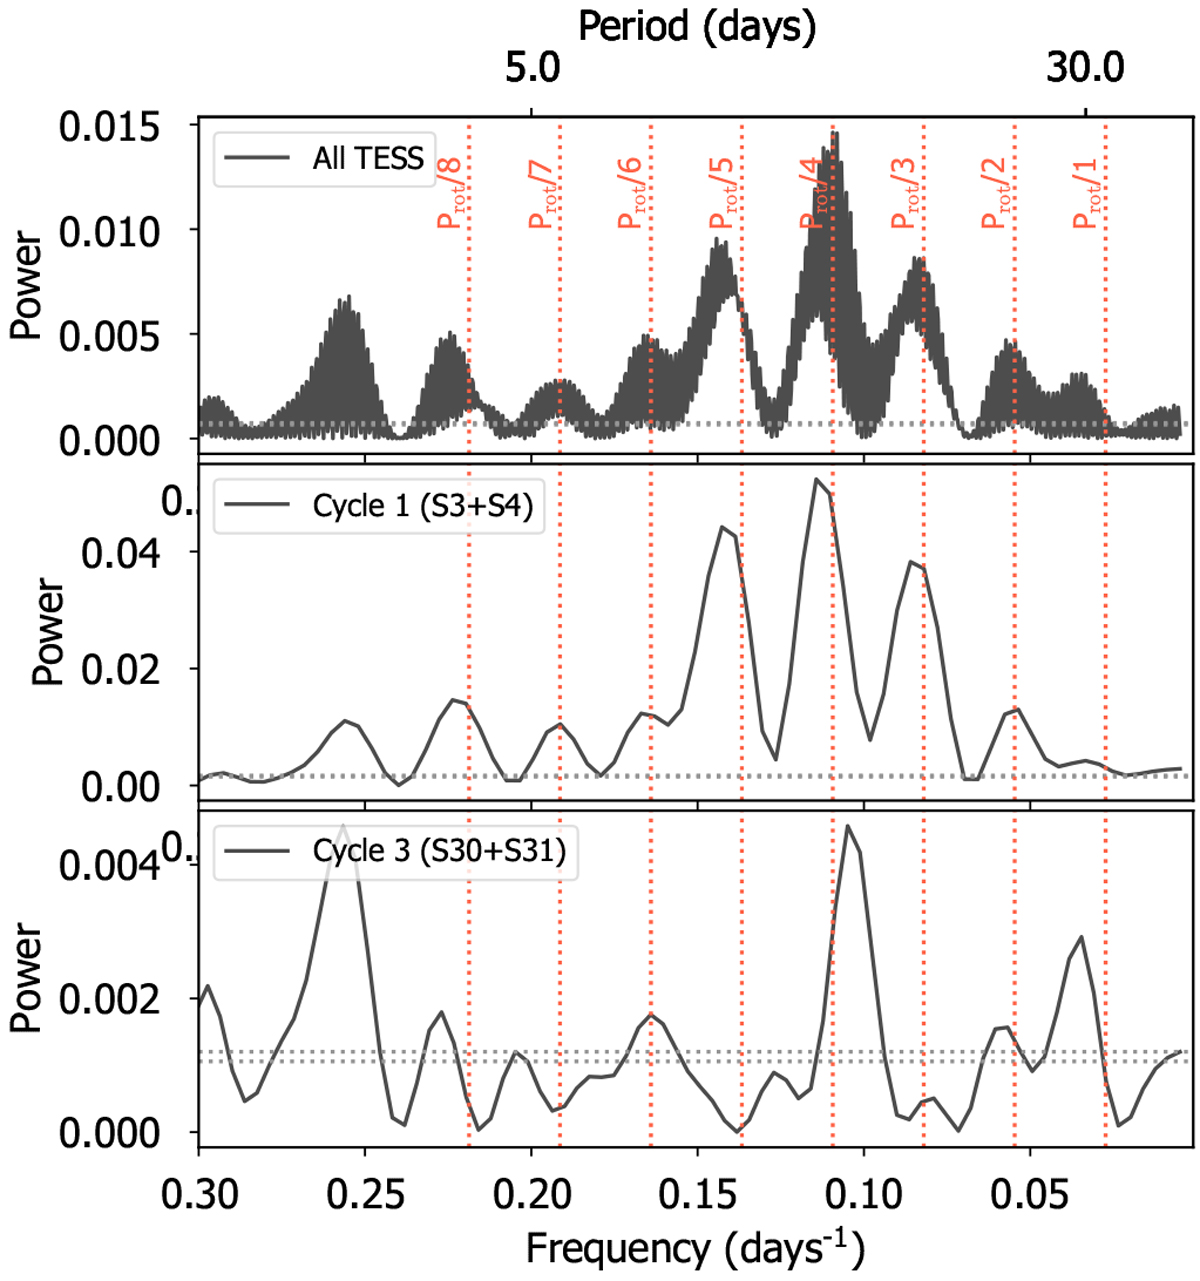
TESS light curve generalized Lomb-Scargle periodogram. Upper panel: GLSP using the full TESS dataset. Middle panel: GLSP using TESS data from Cycle 1, including sectors 3 and 4. Lower panel: GLSP using TESS data from Cycle 3, including sectors 30 and 31. In all panels are highlighted the first eight harmonics of the fundamental frequency corresponding to the expected rotation period of the star according to our RV analysis (see Sect. 3) and corresponding to the expected value from the empirical relations by Suárez Mascareño et al. (2015).
Current usage metrics show cumulative count of Article Views (full-text article views including HTML views, PDF and ePub downloads, according to the available data) and Abstracts Views on Vision4Press platform.
Data correspond to usage on the plateform after 2015. The current usage metrics is available 48-96 hours after online publication and is updated daily on week days.
Initial download of the metrics may take a while.