Fig. 9.

Download original image
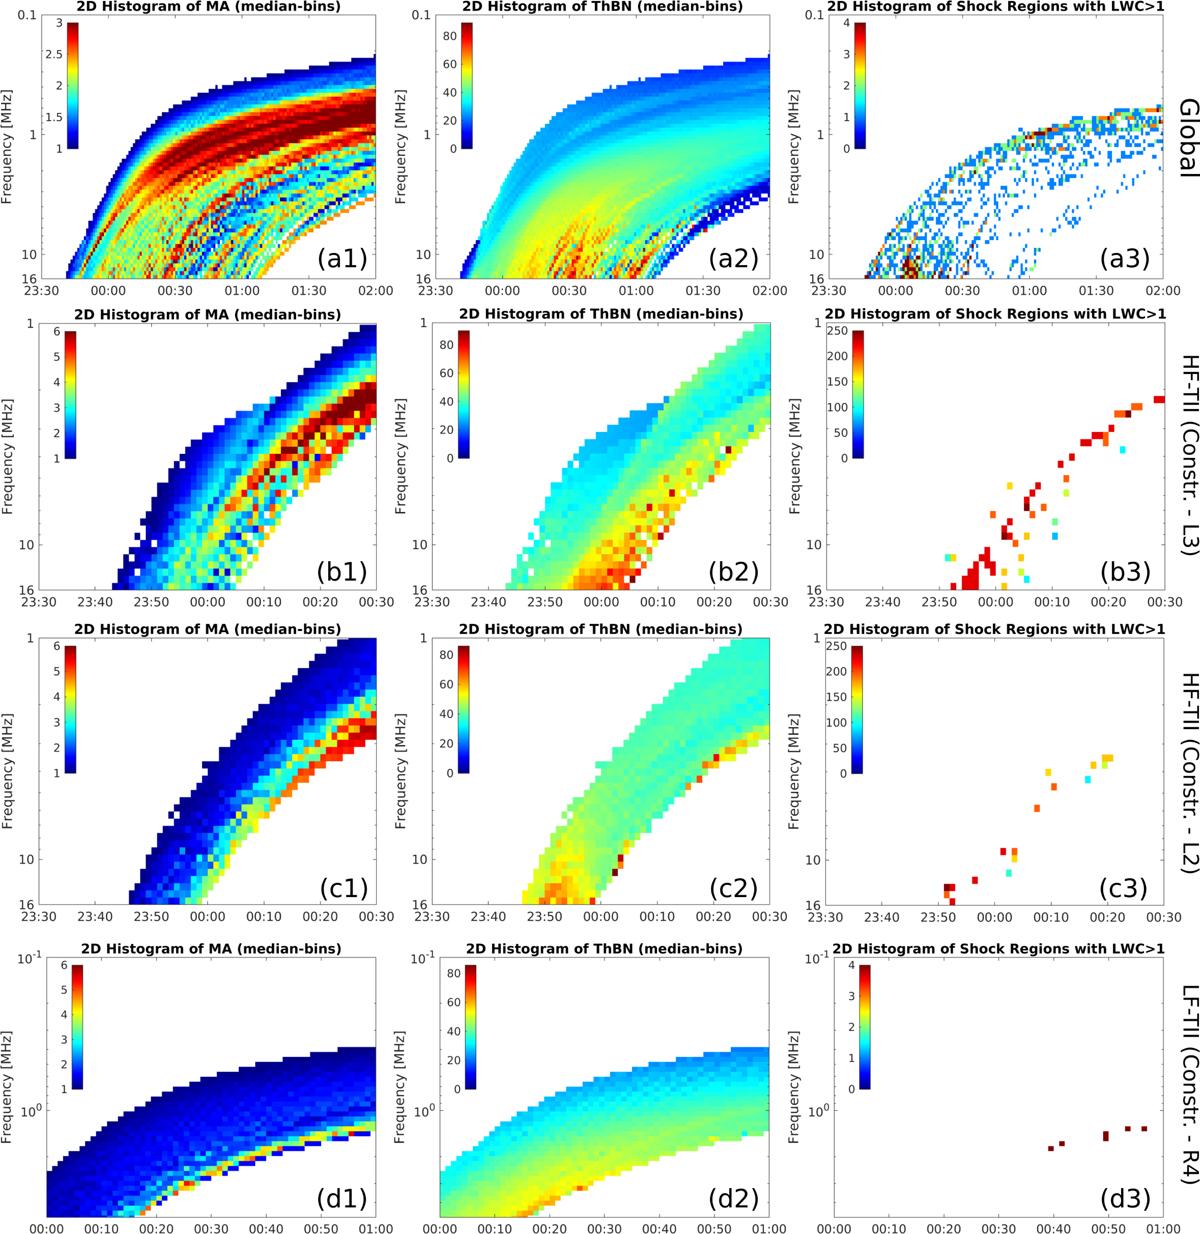
Histogram maps of different shock wave parameters plotted in a form of dynamic spectra. The four rows of 2D-histogram maps were produced in different areas of the wave. The histogram maps were constructed considering: (a) the full shock surface, (b) only L3 region of HF-type II, (c) region L2 of HF-type II (Sect. 5.2.2), and (d) region R4 of LF-type (Sect. 5.2.3). The three columns show different wave parameters: (1) the Alfen Mach number (MA), (2) the Shock wave geometry (θBN), and (3) the Langmuir wave conversion ratio (LWC > 1).
Current usage metrics show cumulative count of Article Views (full-text article views including HTML views, PDF and ePub downloads, according to the available data) and Abstracts Views on Vision4Press platform.
Data correspond to usage on the plateform after 2015. The current usage metrics is available 48-96 hours after online publication and is updated daily on week days.
Initial download of the metrics may take a while.


