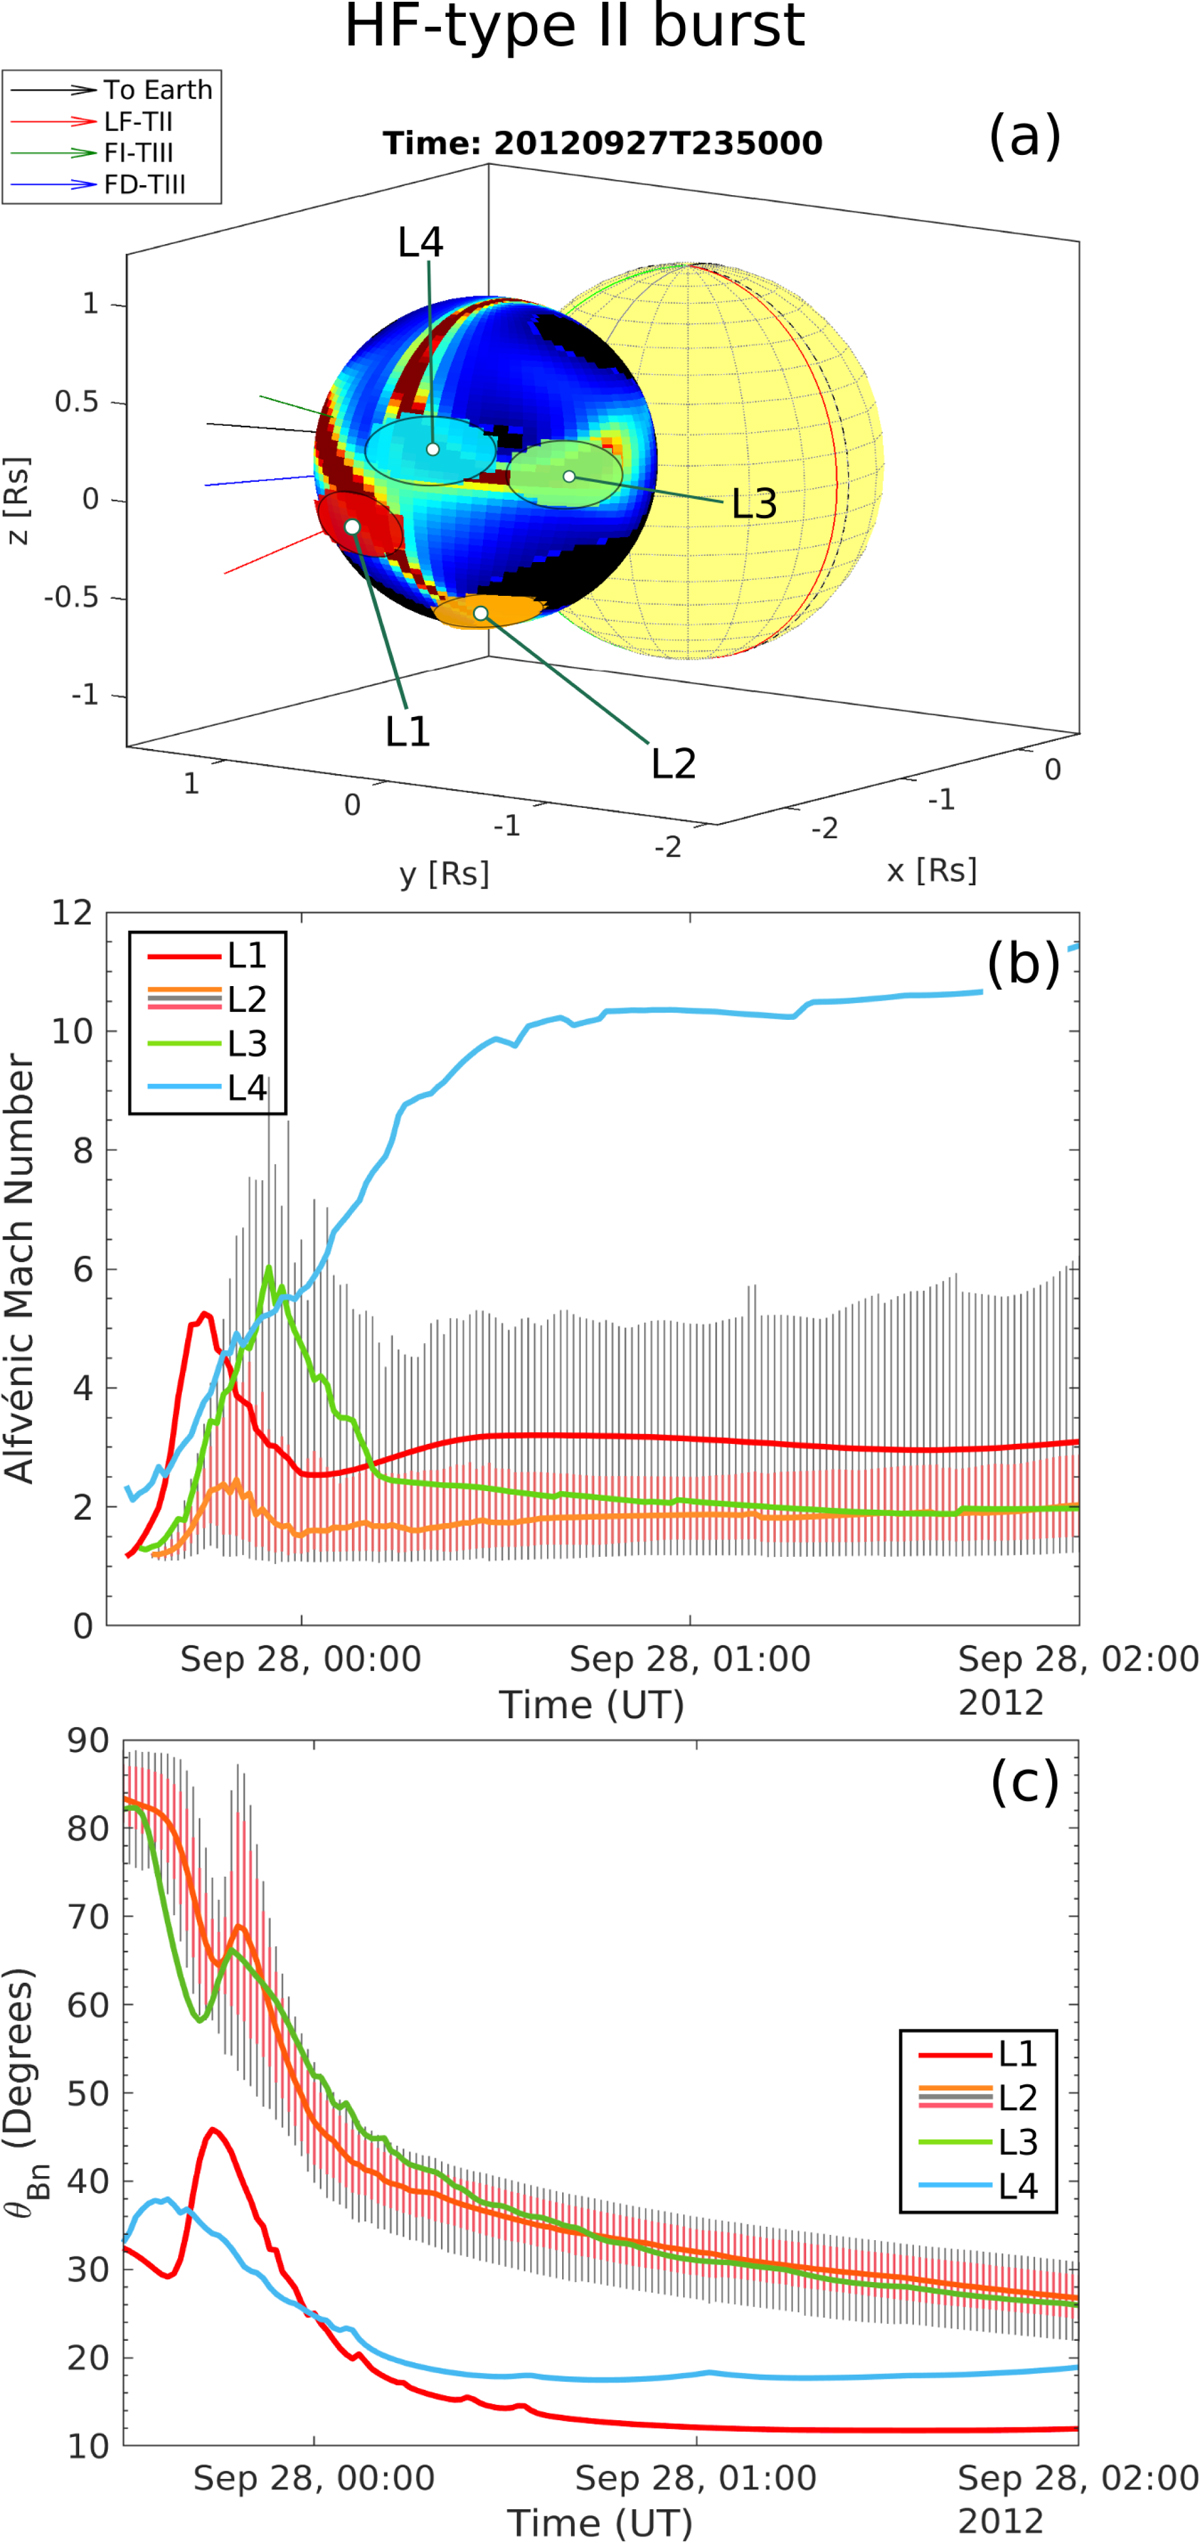
Fig. 7.
Download original image
HF-type II source regions on the pressure wave bubble. Panel a: modelled wave with the values of MA plotted on the wave’s surface roughly around the start of HF-type II radio burst. Circles titled L1–L4 represent the regions where the source of HF-type II could be located. Panel b: temporal evolution of the Alfvén mach number (MA) in the selected regions which are represented by the colored median lines. The quartiles and decile values are given only for L2. The temporal evolution of the geometry in these regions is presented in panel c.
Current usage metrics show cumulative count of Article Views (full-text article views including HTML views, PDF and ePub downloads, according to the available data) and Abstracts Views on Vision4Press platform.
Data correspond to usage on the plateform after 2015. The current usage metrics is available 48-96 hours after online publication and is updated daily on week days.
Initial download of the metrics may take a while.