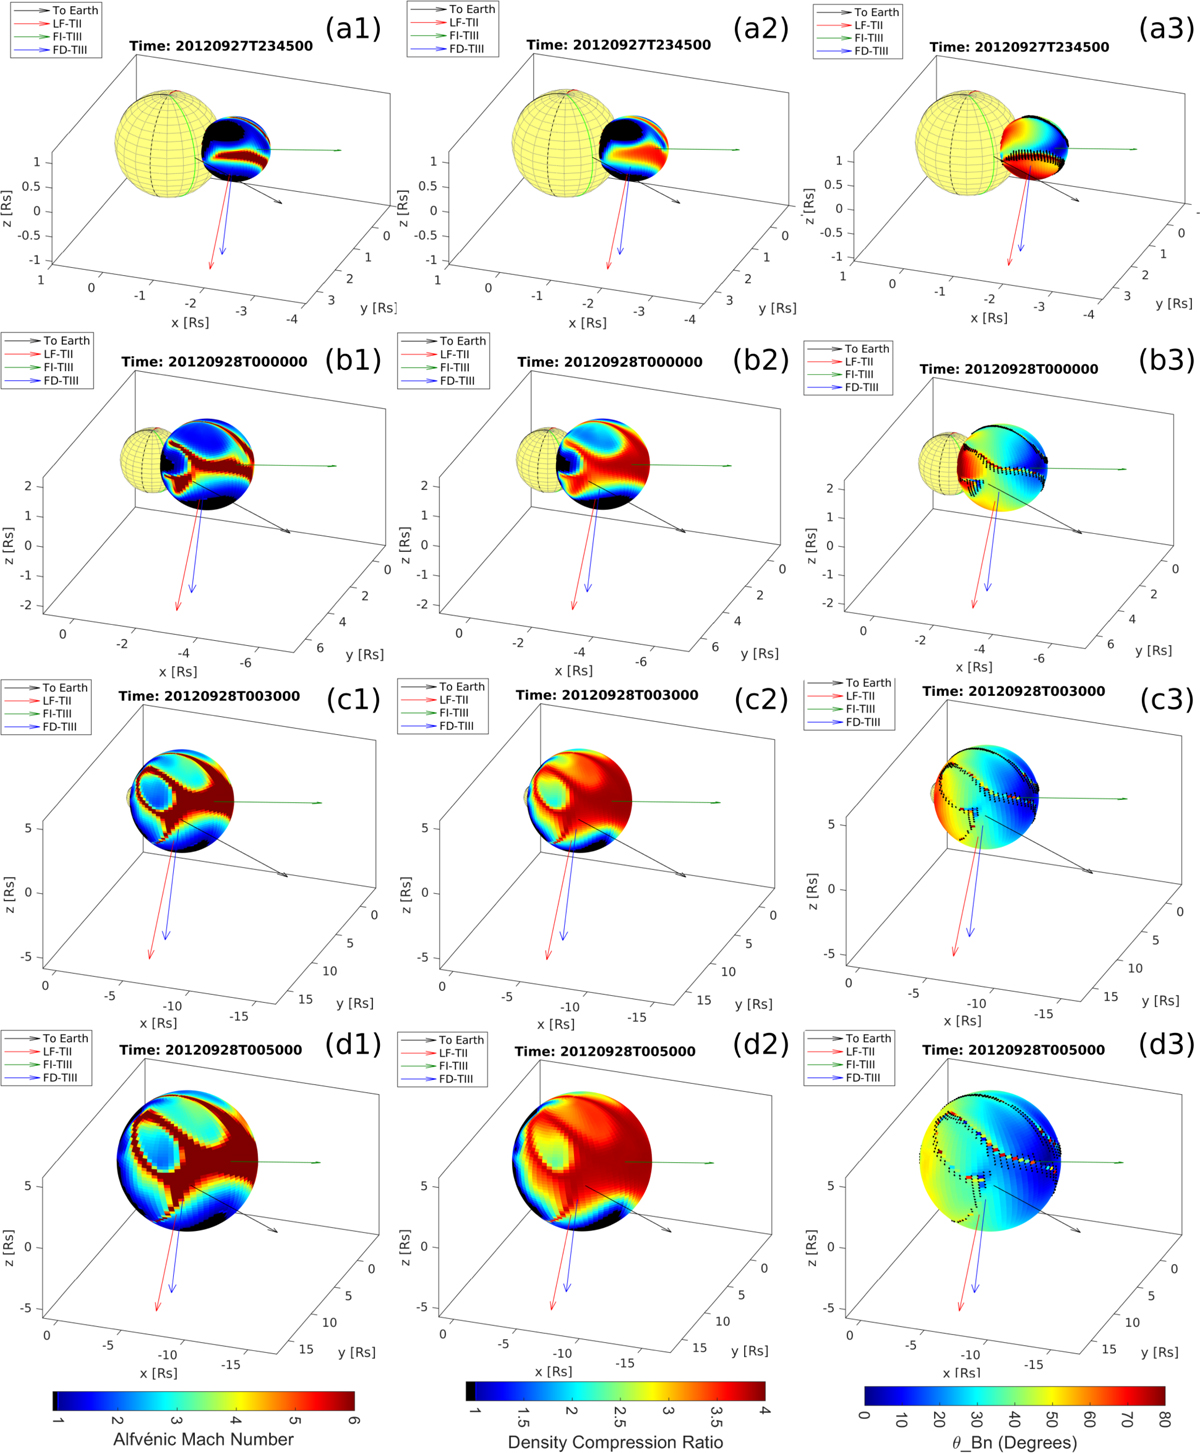
Fig. 5.
Download original image
Snapshots of the modelled shock wave parameters at different times (a–d) and with different parameters estimated at the reconstructed pressure wave front surface (1–3). The yellow sphere represents the Sun and the colour coded ellipse represents the modelled pressure wave. The arrows indicate the propagation direction of the different triangulated radio bursts, while the black arrow indicates the Sun-Earth line. The coloured meridians visible on the surface of the Sun represent the solar central meridian as viewed from STEREO A (red), STEREO B (blue), and Earth (black). The presented times are: the start of the HF-type II (panel a), middle of HF-type II (panel b), start of LF-type II (panel c), and the end of LF-type II (panel d). The different parameters plotted in the rows are, (1) the Alfvén Mach number (MA), (2) the density compression ratio, and (3) the angle between the shock normal and the upstream magnetic field (θBN).
Current usage metrics show cumulative count of Article Views (full-text article views including HTML views, PDF and ePub downloads, according to the available data) and Abstracts Views on Vision4Press platform.
Data correspond to usage on the plateform after 2015. The current usage metrics is available 48-96 hours after online publication and is updated daily on week days.
Initial download of the metrics may take a while.