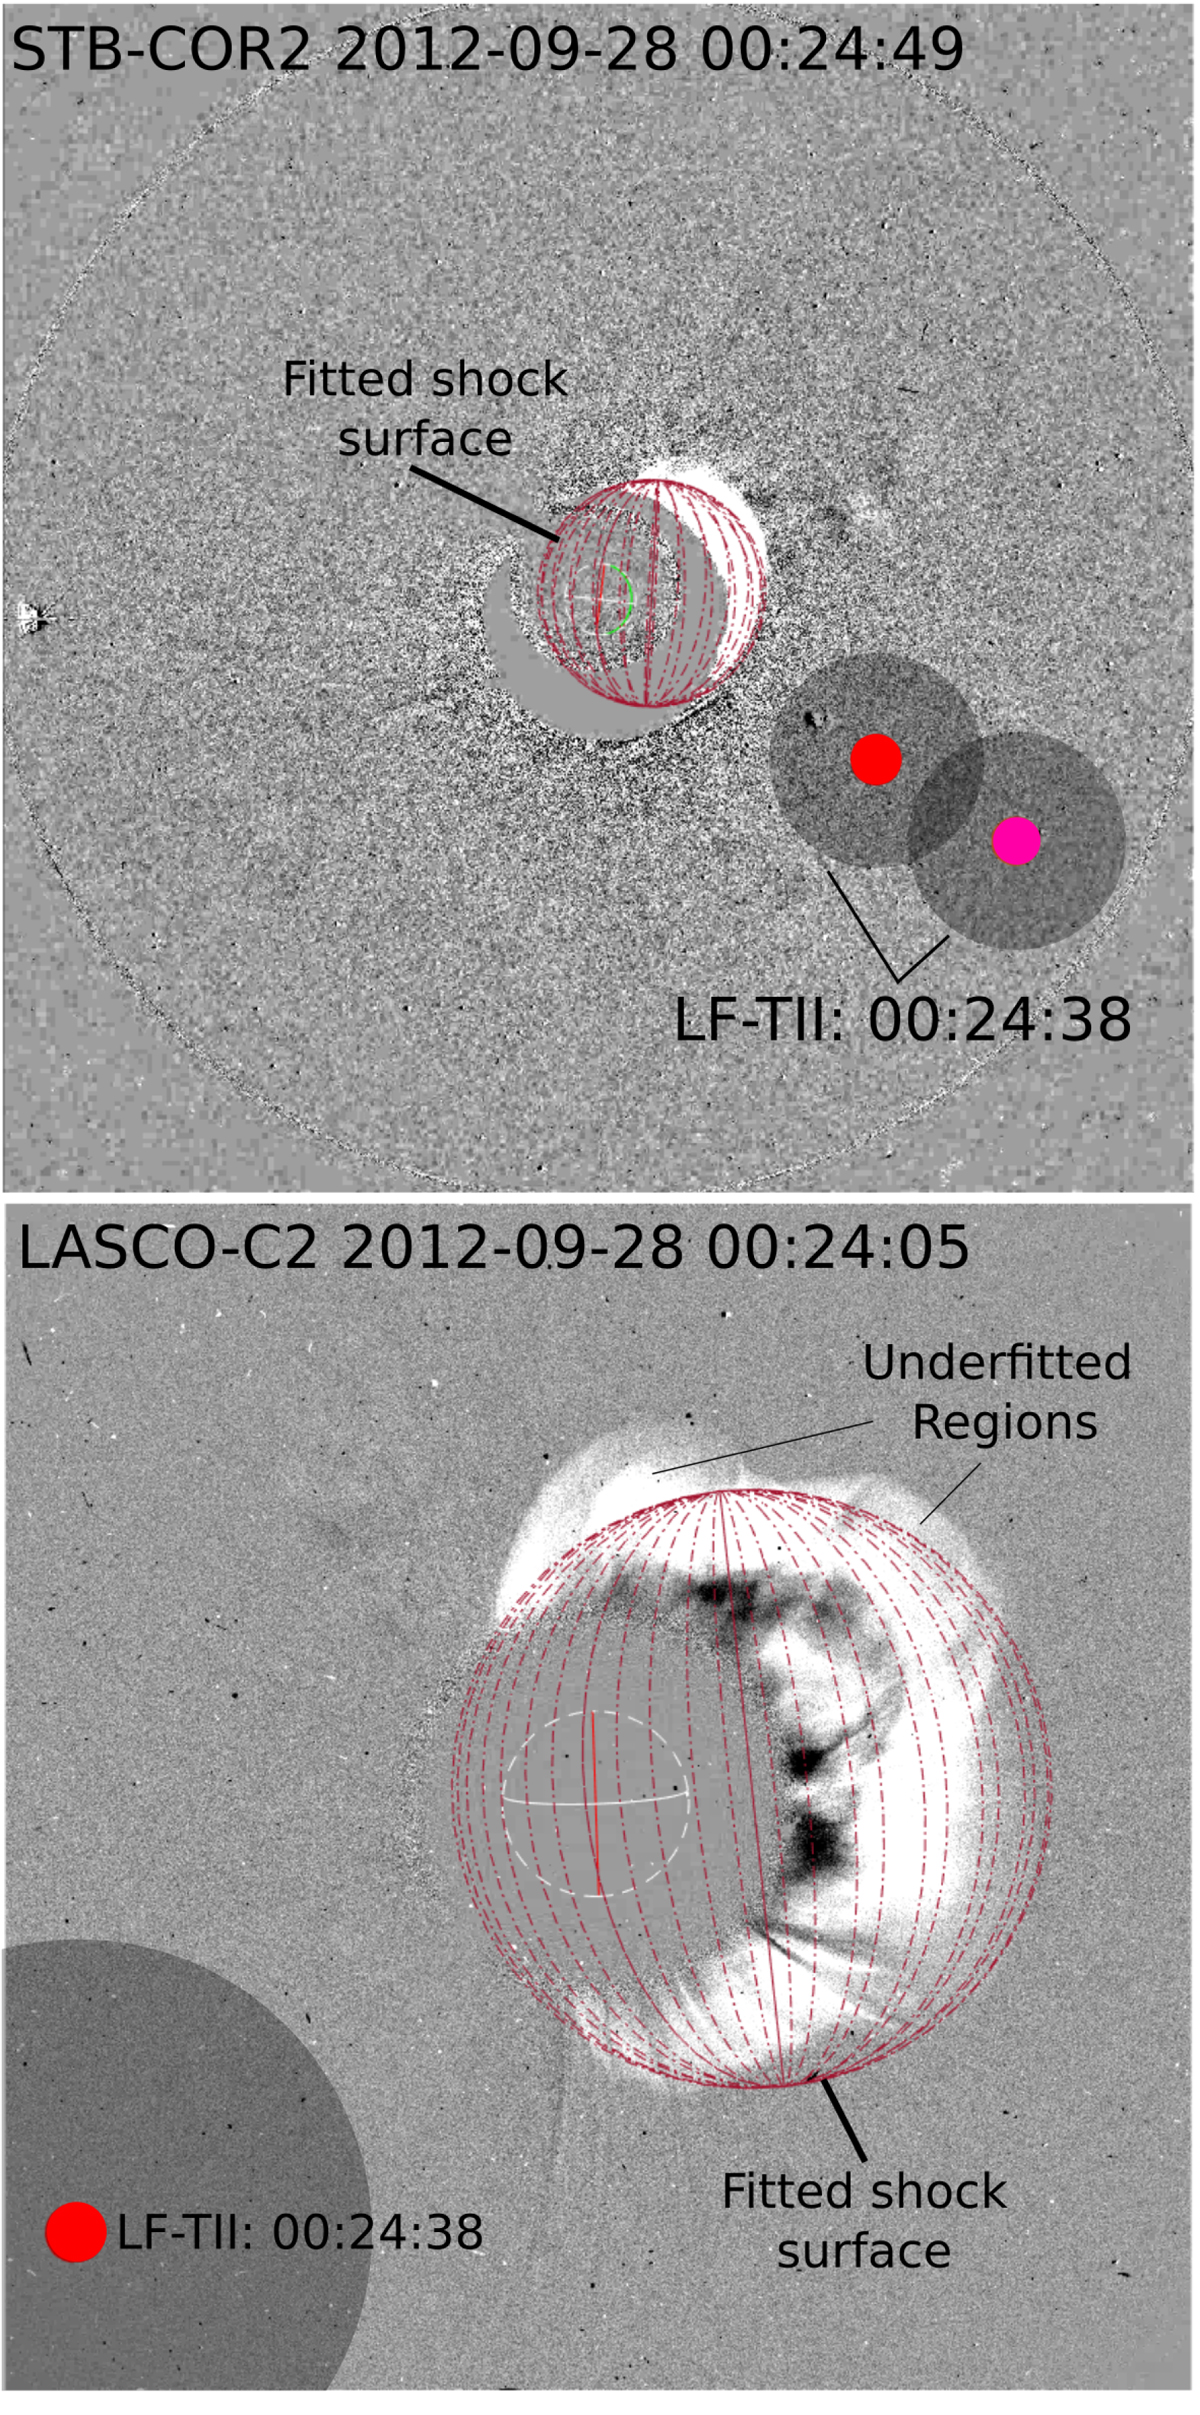
Fig. 4.

Download original image
Shock wave fitting was done using multi-viewpoint observations from STEREO B/COR2 (top panel) and SOHO/LASCO C2 (bottom panel) at 00:24 UT. This is the time of observation of the highest triangulated frequency pair of the LF-type II burst. The red spherical mesh represents the fit to the white light shock. The regions indicated as under-fitted are the regions that are not accounted for in the shock wave modelling. The red and the fuchsia points are the centroids of the highest frequency LF-type II sources and the dark-shaded region is the full source region obtained from radio triangulation.
Current usage metrics show cumulative count of Article Views (full-text article views including HTML views, PDF and ePub downloads, according to the available data) and Abstracts Views on Vision4Press platform.
Data correspond to usage on the plateform after 2015. The current usage metrics is available 48-96 hours after online publication and is updated daily on week days.
Initial download of the metrics may take a while.


