Fig. 8

Download original image
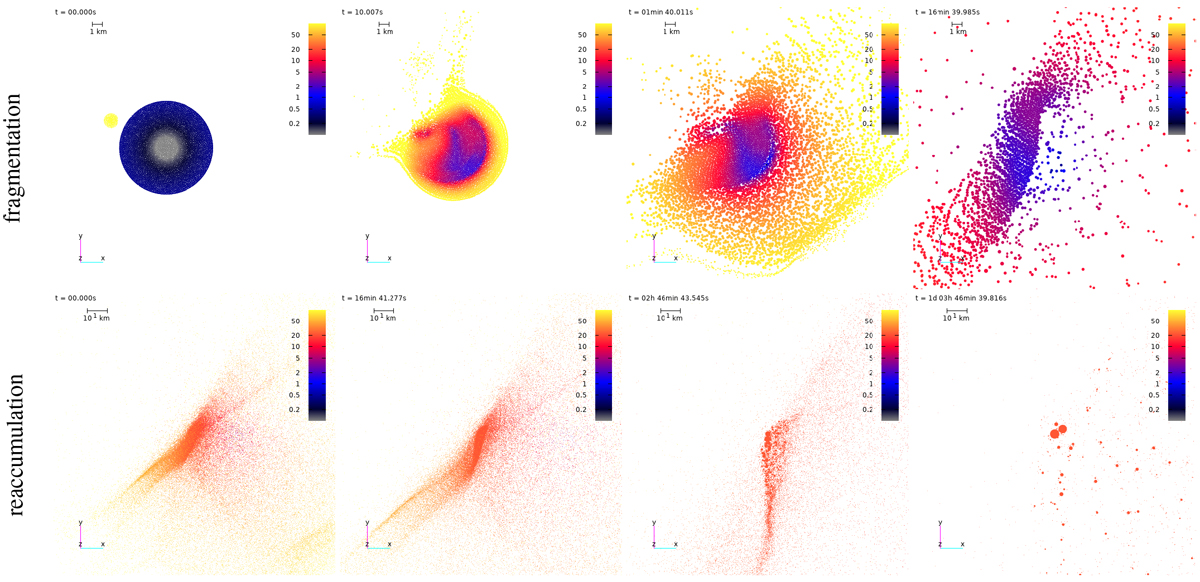
Snapshots from an SPH/N-body simulation of a single parent body breakup. The basic parameters were a target size Dtar =9 km, an impactor size Dimp = 1.3 km, an impact angle ϕ = 30° (“near-to-head-on situation”), and an impact velocity v = 5 km s−1. The fragmentation phase is shown for the epochs t = 0, 10, 100, 103 s (top, a–d from left to right), and the reaccumulation phase for t = 0, 103, 104, 105 s (after handoff; bottom, e–h from left to right). The spatial distribution of SPH particles is plotted only within a limited range of the coordinate z ∈ (−1, 1) km to clearly show the interior structure of the parent body, its damage, and the clump formation zones. Colors correspond to the velocity v in m s−1 relative to the target body (scale shown using the bar). Individual panels can be described as follows: (a) the initial conditions, (b) high-speed ejecta formed at the impact site, (c) formation of a cavity with low relative speeds, (d) deformationof the target, (e) handoff phase, (f) streams of high speed, individual particles escaping from the system, (g) ongoing reaccumulation, and (h) formation of an unbound, nearly equal-size pair accompanied by the subkilometer fragments. (Animation is available online and at https://sirrah.troja.mff.cuni.cz/~mira/hobson/hobson.html).
Current usage metrics show cumulative count of Article Views (full-text article views including HTML views, PDF and ePub downloads, according to the available data) and Abstracts Views on Vision4Press platform.
Data correspond to usage on the plateform after 2015. The current usage metrics is available 48-96 hours after online publication and is updated daily on week days.
Initial download of the metrics may take a while.


