Fig. 7
Download original image
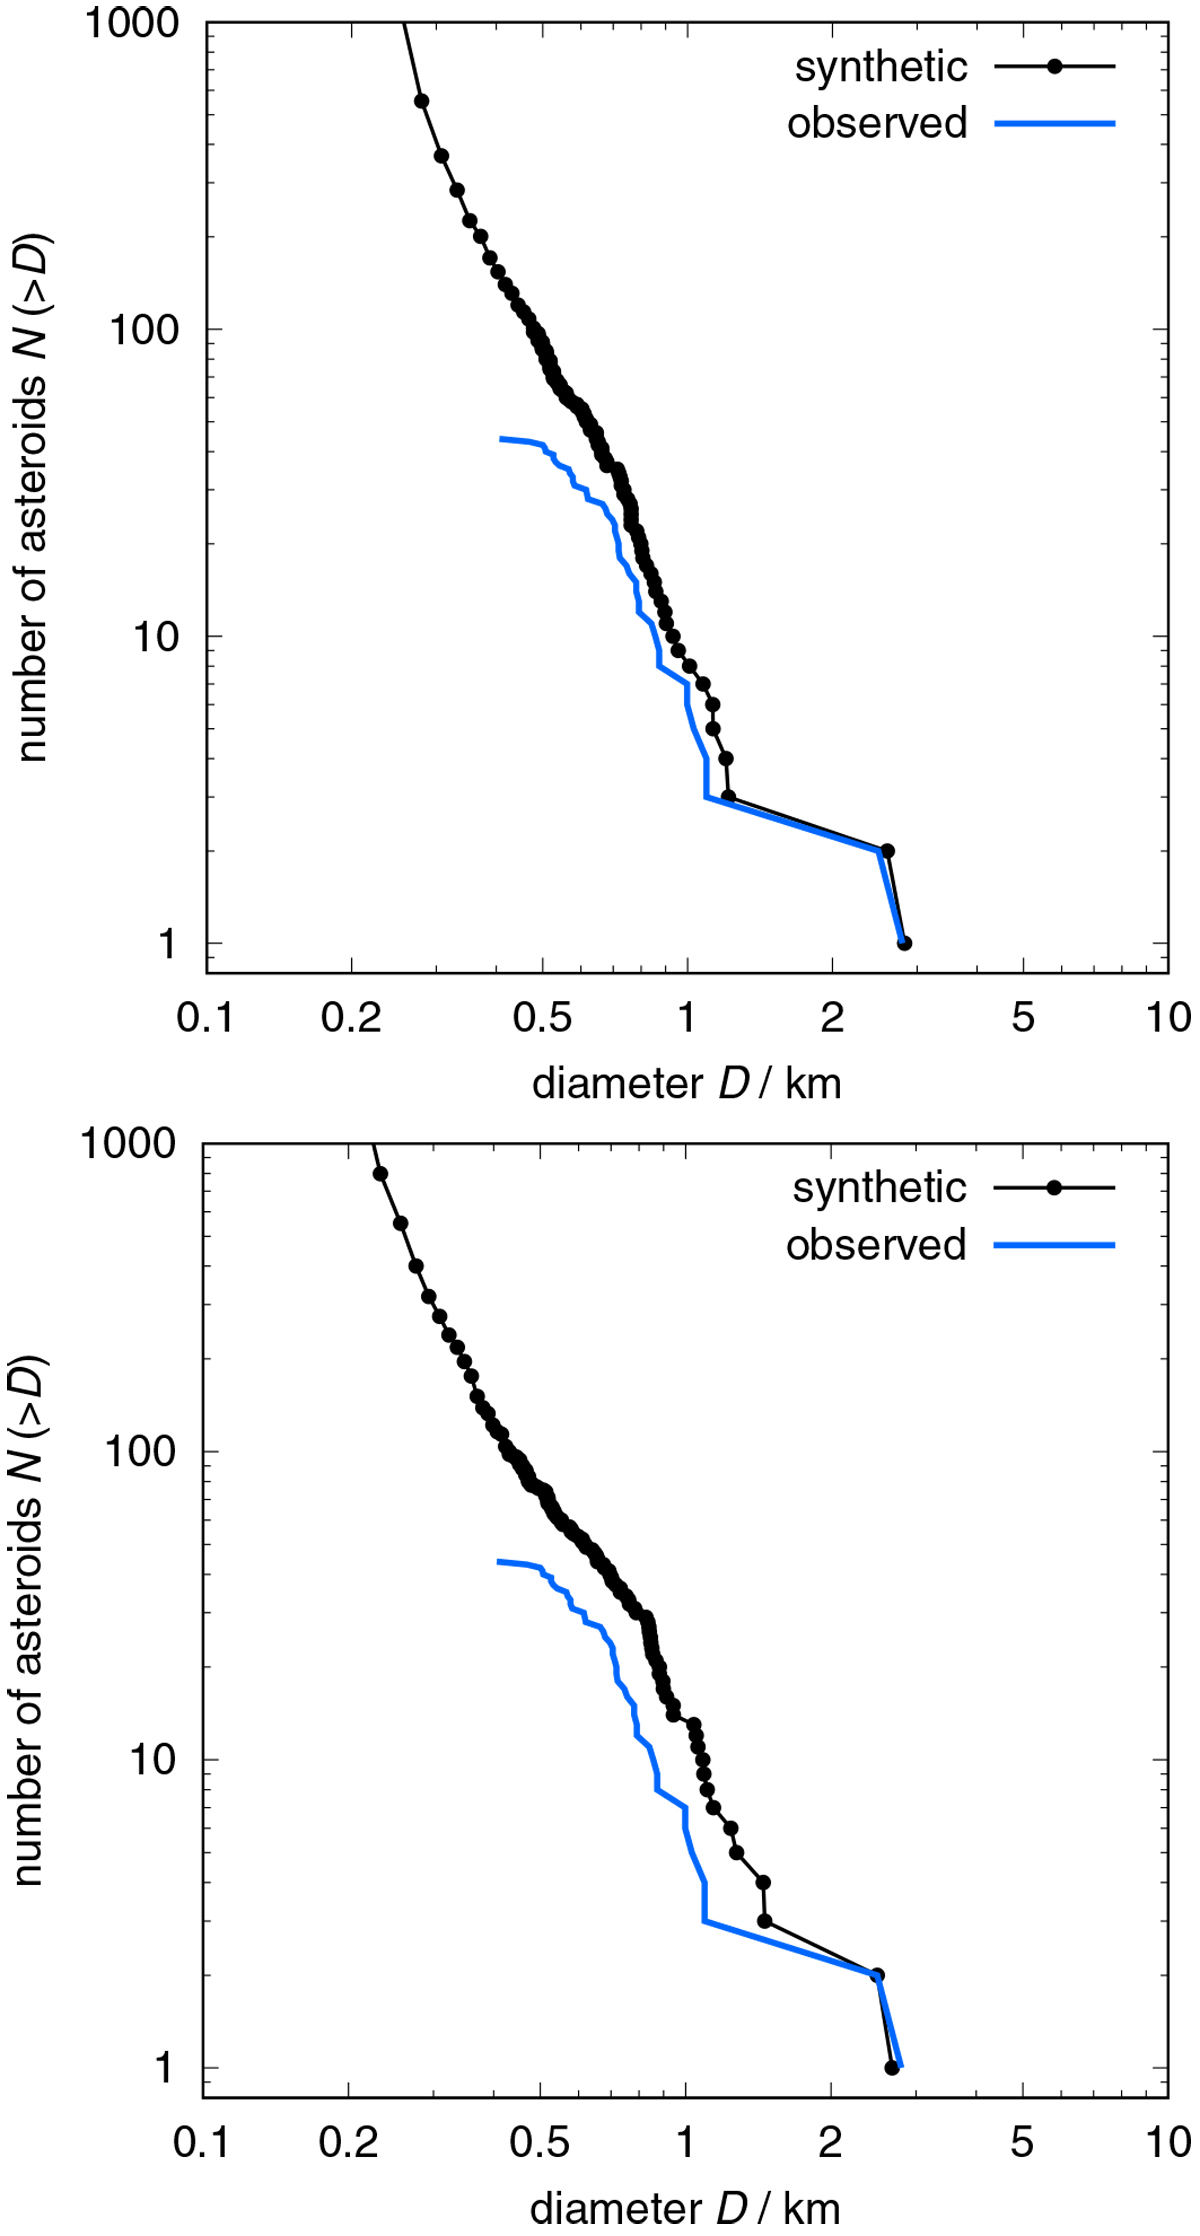
Cumulative size-frequency distributions N(>D) of the fragments produced in the simulation where the parent object was a single asteroid (top) and a binary system (bottom). The observed Hobson-family data are shown with a blue line (assuming geometric albedo pV = 0.2 as in Fig. 3). A slight shift in the populations of kilometer-size and smaller fragments may be partly explained by the incompleteness of the observed family.
Current usage metrics show cumulative count of Article Views (full-text article views including HTML views, PDF and ePub downloads, according to the available data) and Abstracts Views on Vision4Press platform.
Data correspond to usage on the plateform after 2015. The current usage metrics is available 48-96 hours after online publication and is updated daily on week days.
Initial download of the metrics may take a while.