Fig. 6
Download original image
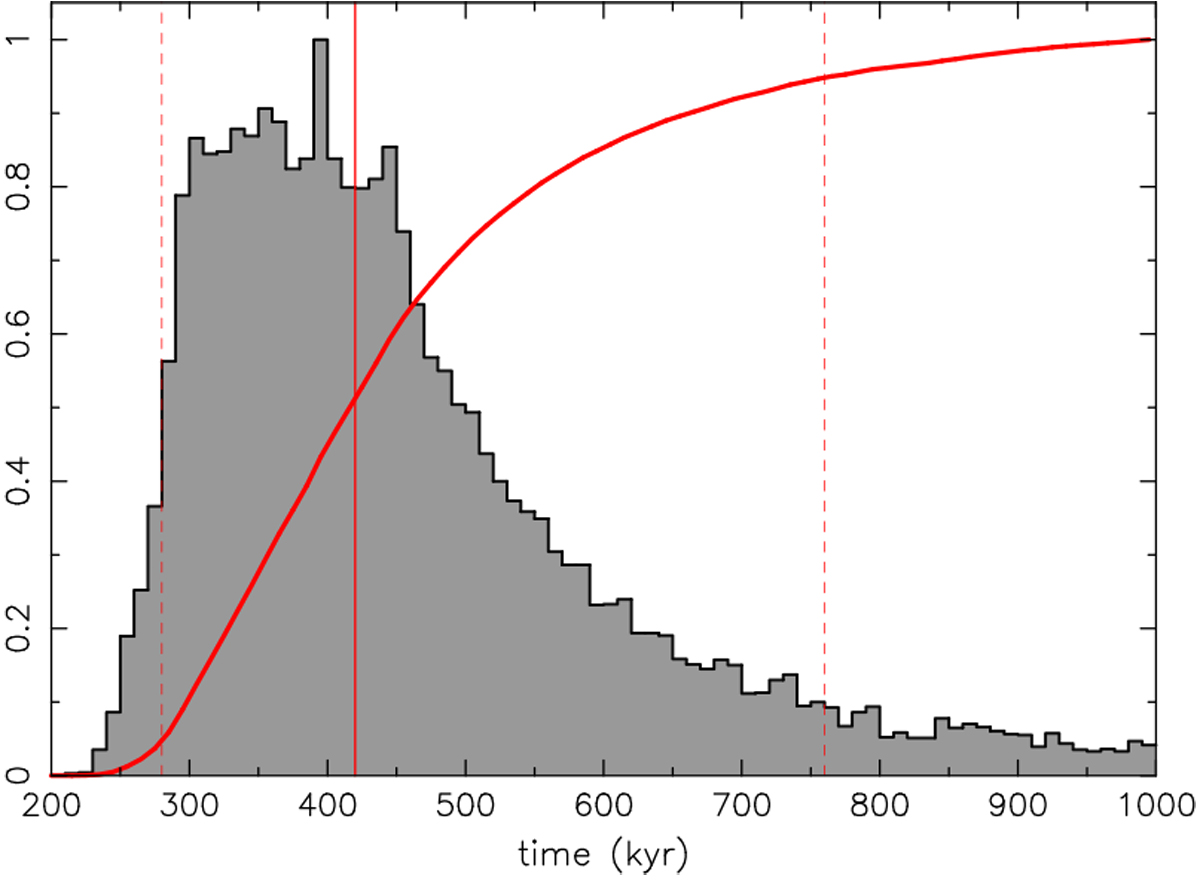
Distribution of convergent configurations for clones of (18777) Hobson and (57738) 2001 UZ160 in Cartesian space with the following criteria: (i) physical distance ≤ 10000 km, and (ii) relative velocity ≤4 m s−1. The gray histogram is a differential distribution using 10 kyr bins normalized to maximum convergent cases in a bin. The red line is a cumulative distribution. Time at abscissa extends to the past. Red vertical lines delimit median convergent time (solid), 5 and 95% levels of the cumulative distribution (dashed).
Current usage metrics show cumulative count of Article Views (full-text article views including HTML views, PDF and ePub downloads, according to the available data) and Abstracts Views on Vision4Press platform.
Data correspond to usage on the plateform after 2015. The current usage metrics is available 48-96 hours after online publication and is updated daily on week days.
Initial download of the metrics may take a while.