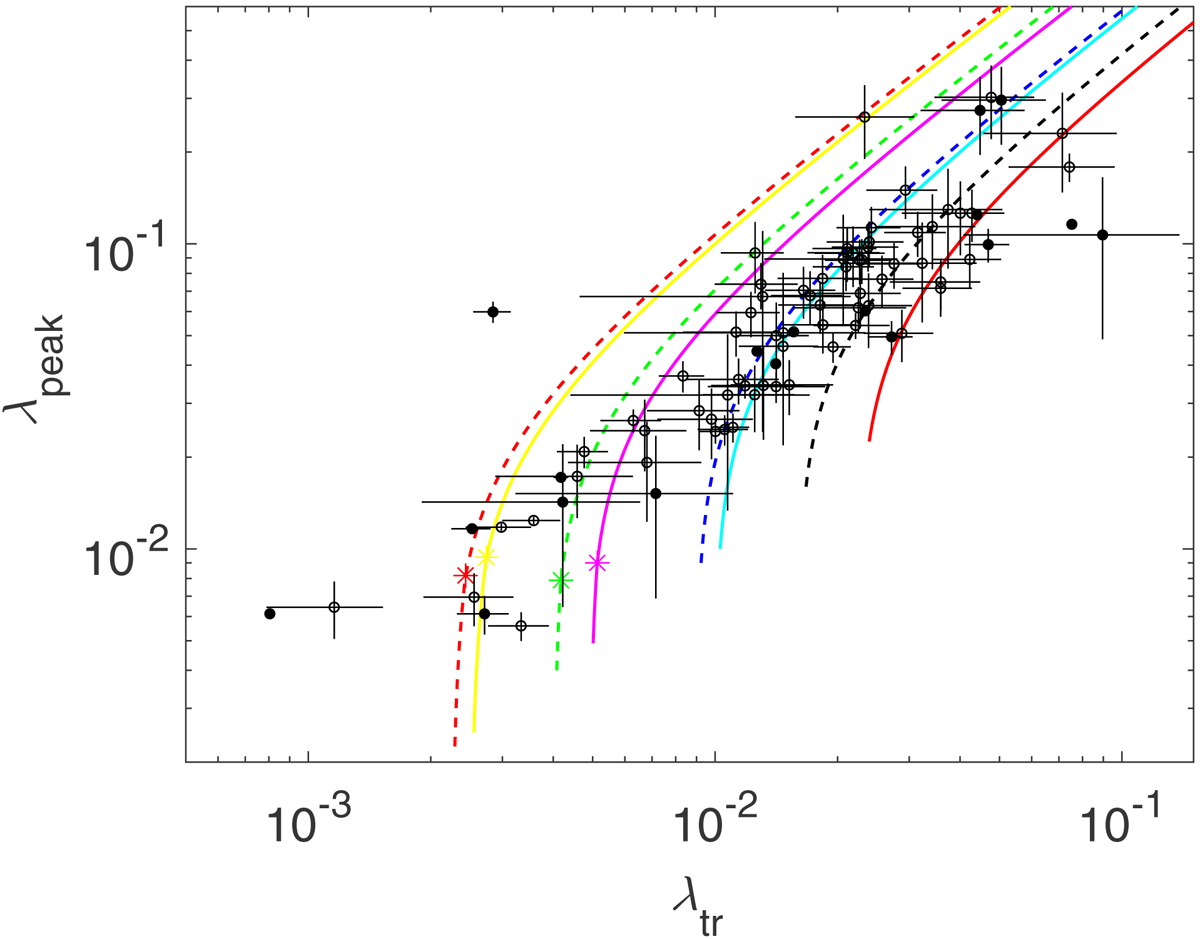
Fig. 2.
Download original image
Correlation between λtr and λpeak. The circles are NSXRBs, while the dots show the BH counterparts. The data are taken from the literature (Yu & Yan 2009; Yan & Yu 2017; Cúneo et al. 2020). The solid lines are the model calculations for BHXRBs (i.e., ξc = 1), and the dashed lines are for NSXRBs (i.e., ξc = 0.1). The different colors indicate the results calculated with different values of the viscosity parameter: α = 0.05 (yellow), 0.07 (magenta), 0.1 (cyan), 0.15 (red), 0.2 (green), 0.3 (blue), and 0.4 (black). The stars indicate the case of the radiation pressure equaling the gas pressure in the outer disk at Rtr. The transition radius rtr = 20 is adopted in all calculations.
Current usage metrics show cumulative count of Article Views (full-text article views including HTML views, PDF and ePub downloads, according to the available data) and Abstracts Views on Vision4Press platform.
Data correspond to usage on the plateform after 2015. The current usage metrics is available 48-96 hours after online publication and is updated daily on week days.
Initial download of the metrics may take a while.