Fig. A.5.
Download original image
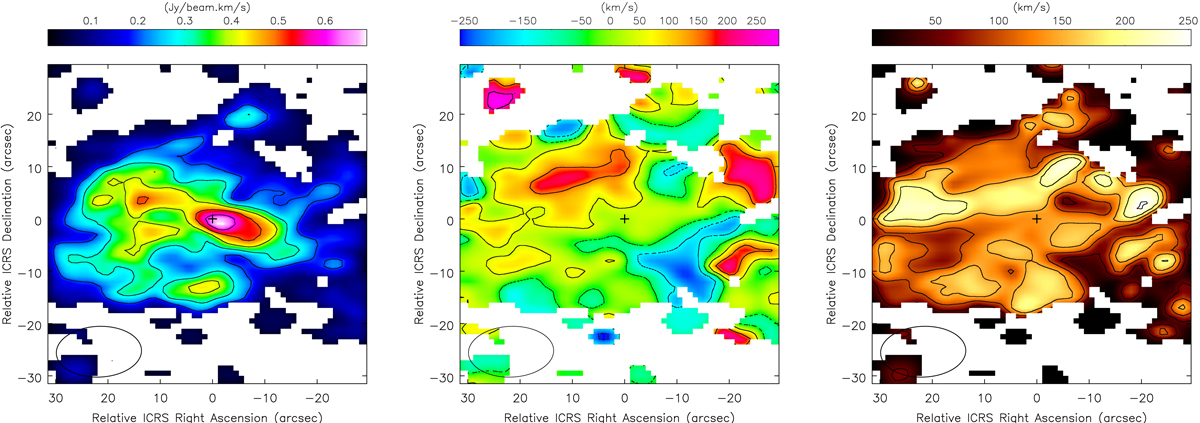
ACA CO(3-2) moment maps, produced by selecting the velocity range to −300 < v[km s−1]< 300. The left panel shows the zeroth moment map (flux), with contours at [0.2, 0.3, 0.4, 0.5, 0.6] Jy beam−1 km s−1; the middle panel shows the first moment map (velocity), with contours corresponding to [-250, -150, -50, 50, 150, 250] km s−1; the right panel shows the second moment map (σv), with contours at [50, 100, 150, 200, 250] km s−1. The black cross indicates the AGN position, whose coordinates are reported in Table 1.
Current usage metrics show cumulative count of Article Views (full-text article views including HTML views, PDF and ePub downloads, according to the available data) and Abstracts Views on Vision4Press platform.
Data correspond to usage on the plateform after 2015. The current usage metrics is available 48-96 hours after online publication and is updated daily on week days.
Initial download of the metrics may take a while.