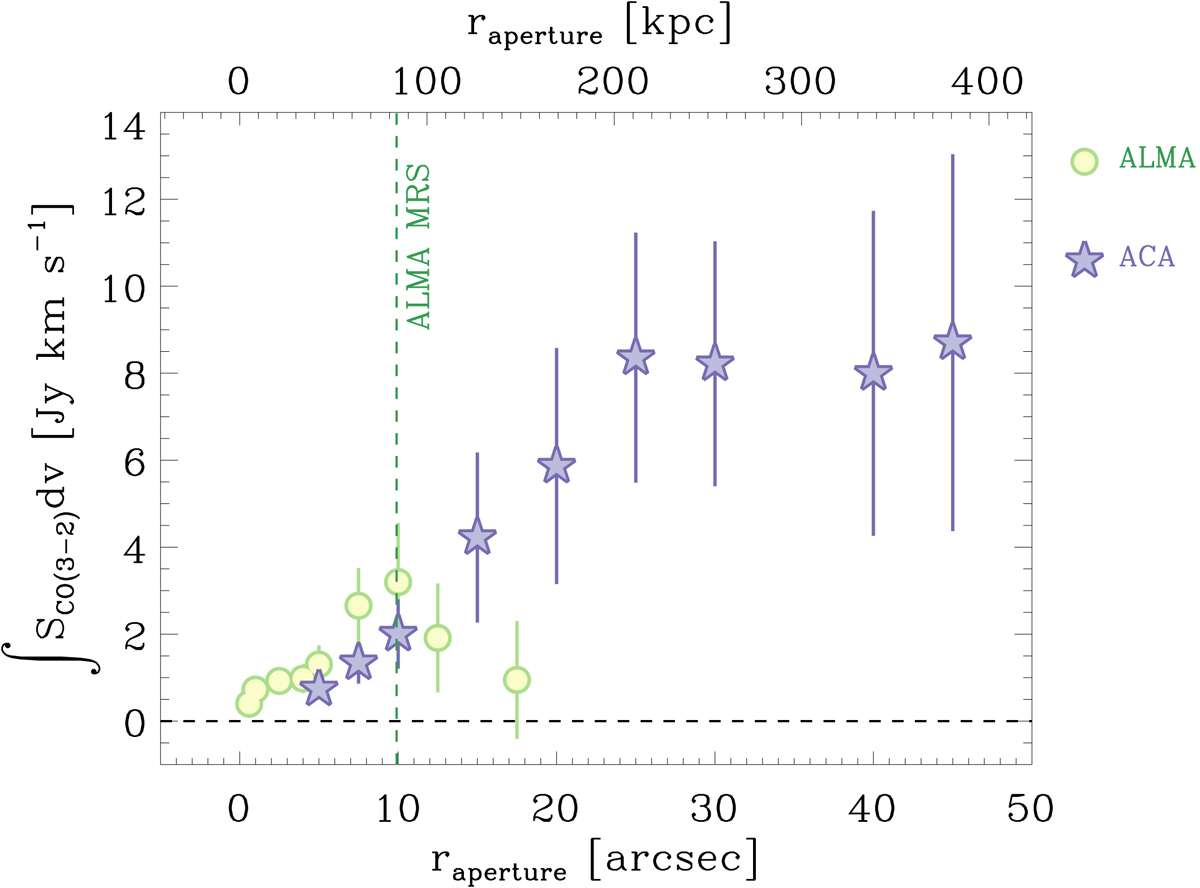
Fig. 3.
Download original image
Curve of growth of the CO(3−2) line emission, showing the integrated flux as a function of the radius of the aperture used for spectra extraction. The fluxes were computed through a Gaussian fitting (details in Appendix A.3). Vertical lines correspond to the MRS of the ALMA and ACA data. Error bars include nominal calibration uncertainties (5% for both ALMA and ACA Band 3). Our ALMA data are not reliable for measuring fluxes beyond r > 10″, where aperture dilution effects become severe due to the poor sensitivity to extended and redshifted components.
Current usage metrics show cumulative count of Article Views (full-text article views including HTML views, PDF and ePub downloads, according to the available data) and Abstracts Views on Vision4Press platform.
Data correspond to usage on the plateform after 2015. The current usage metrics is available 48-96 hours after online publication and is updated daily on week days.
Initial download of the metrics may take a while.