Fig. 1.
Download original image
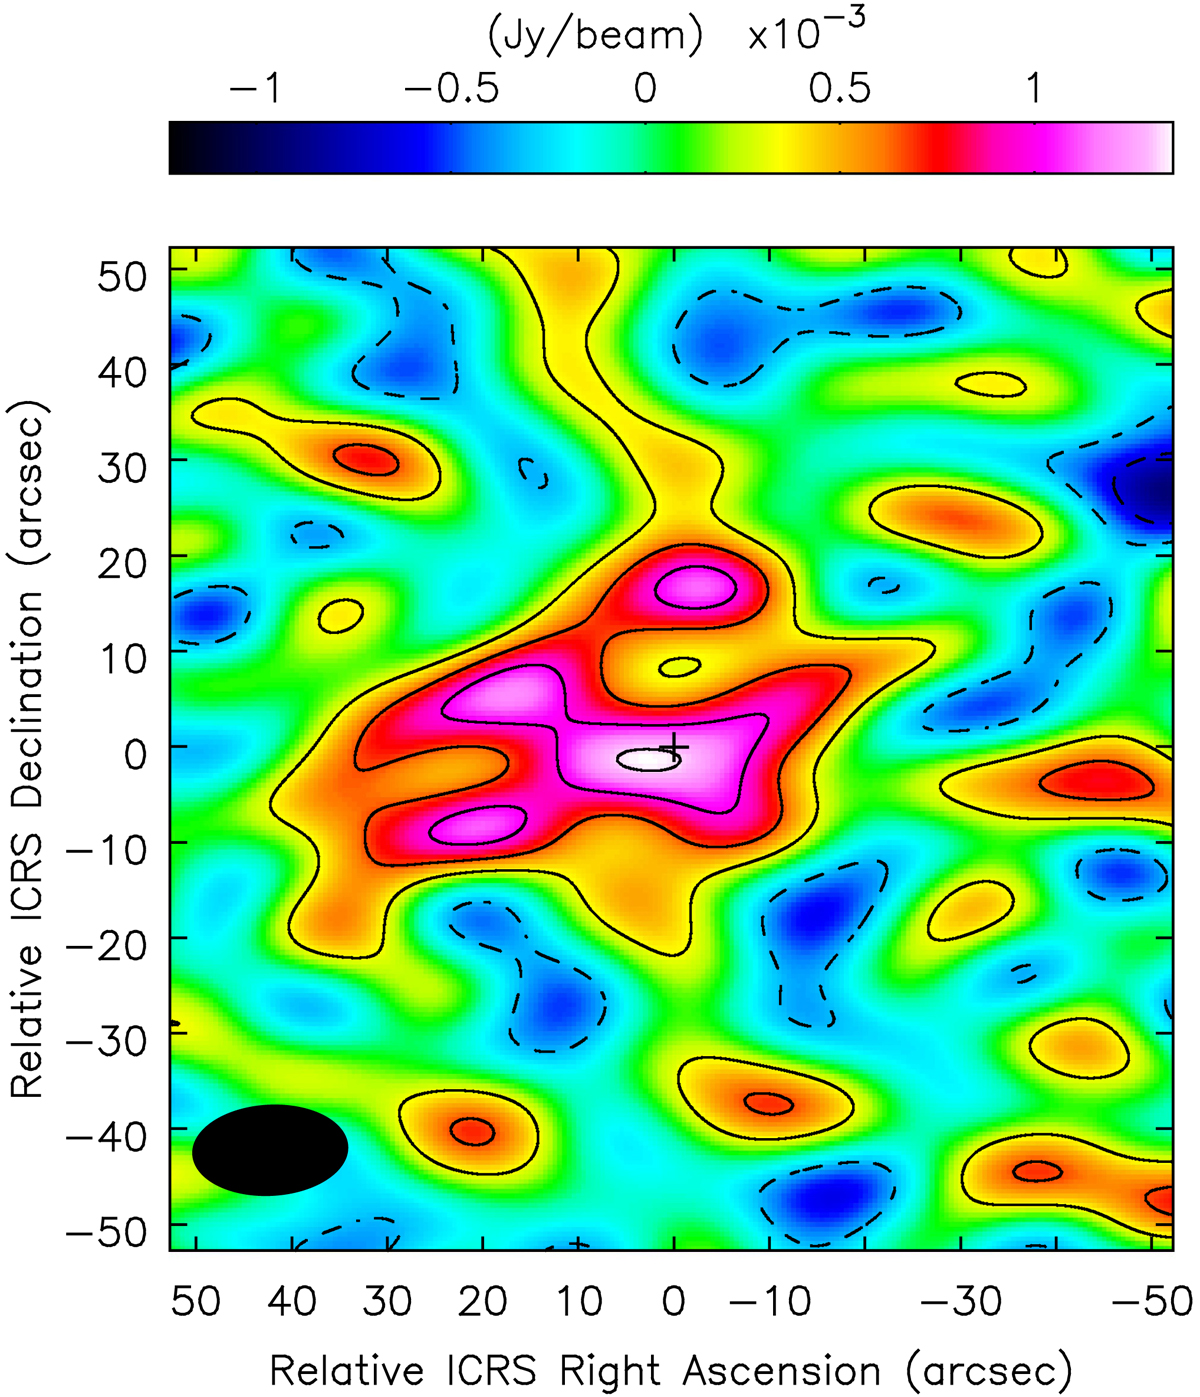
ACA map obtained by integrating the CO(3−2) line emission within −400 < v[km s−1]< 1000. For visualisation purposes, the map has not been divided by the primary beam profile, hence the noise is uniform across the field. Negative contours are shown as dashed curves. Both negative and positive contours are plotted in steps of 1σ starting from ±1σ, with a 1σ = 0.33 mJy beam−1. The phase centre is indicated with a black cross (see coordinates in Table 1) and corresponds to the AGN position.
Current usage metrics show cumulative count of Article Views (full-text article views including HTML views, PDF and ePub downloads, according to the available data) and Abstracts Views on Vision4Press platform.
Data correspond to usage on the plateform after 2015. The current usage metrics is available 48-96 hours after online publication and is updated daily on week days.
Initial download of the metrics may take a while.