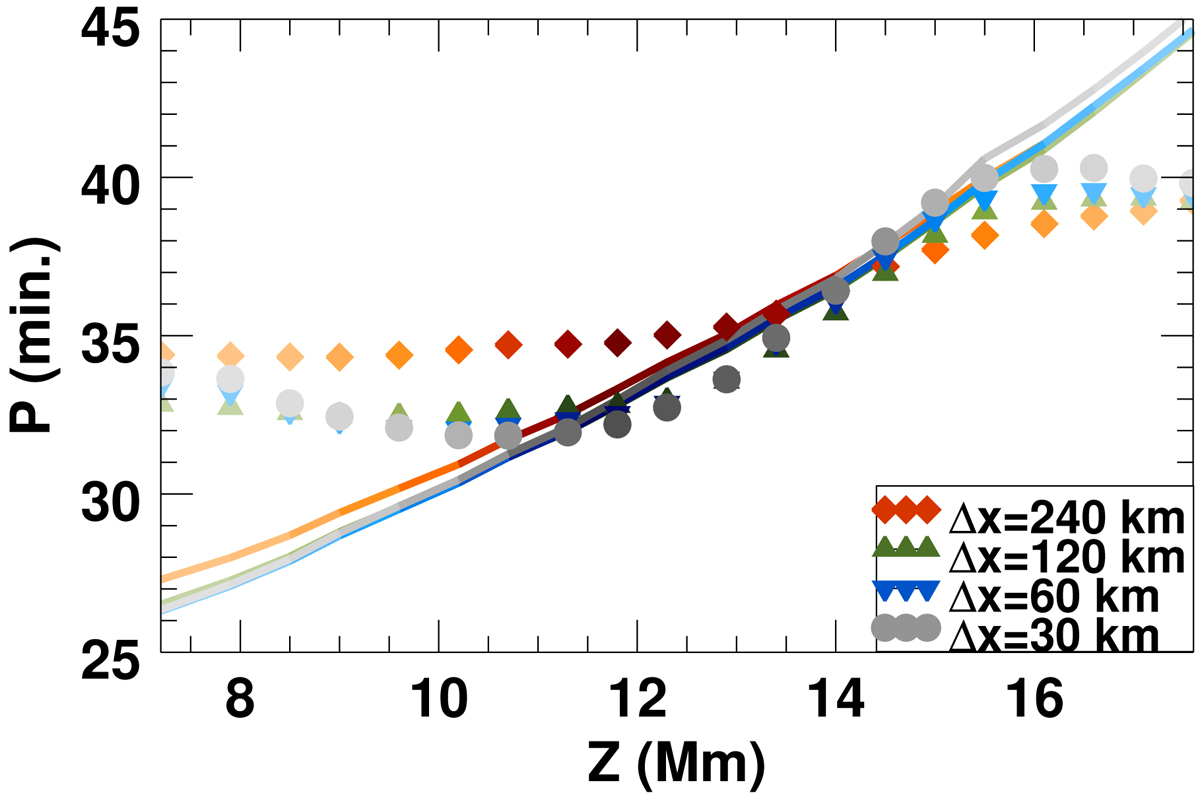
Fig. 4.
Download original image
Periods as a function of height of the magnetic dips. The symbols denote the longitudinal period obtained from the numerical experiments, and the solid lines are the periods predicted by the pendulum model. Different colors and symbols correspond to the experiments with different spatial resolutions. The color gradation from dark to light corresponds to a decrease in the density contrast.
Current usage metrics show cumulative count of Article Views (full-text article views including HTML views, PDF and ePub downloads, according to the available data) and Abstracts Views on Vision4Press platform.
Data correspond to usage on the plateform after 2015. The current usage metrics is available 48-96 hours after online publication and is updated daily on week days.
Initial download of the metrics may take a while.