Fig. 11.
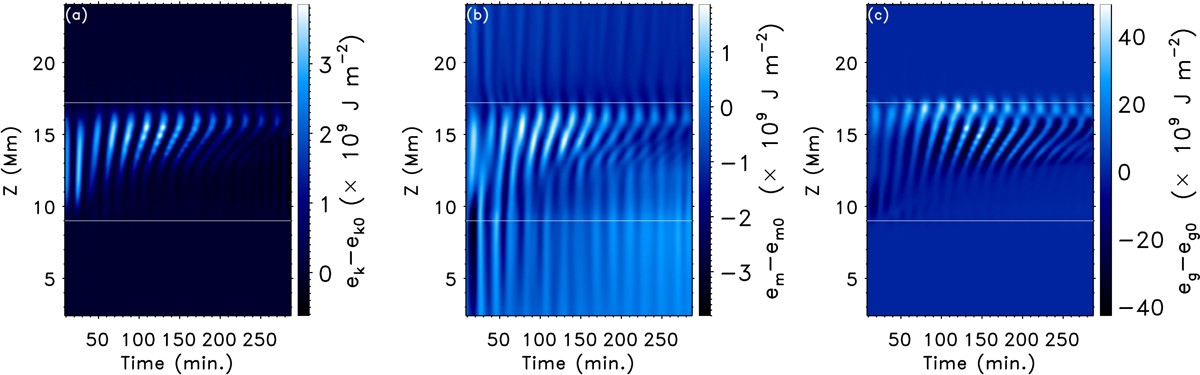
Download original image
Time–distance diagram of the energy variations with respect to their values immediately before the perturbation, e − e0, integrated in the region from x = −12 Mm to x = 12 Mm. The white lines denote the heights where the prominence is located. (a) Kinetic energy density, ek = ρv2/2; (b) magnetic energy density, eB = B2/2μ0; (c) gravitational energy density, eg = ρgz.
Current usage metrics show cumulative count of Article Views (full-text article views including HTML views, PDF and ePub downloads, according to the available data) and Abstracts Views on Vision4Press platform.
Data correspond to usage on the plateform after 2015. The current usage metrics is available 48-96 hours after online publication and is updated daily on week days.
Initial download of the metrics may take a while.