Fig. 6.
Download original image
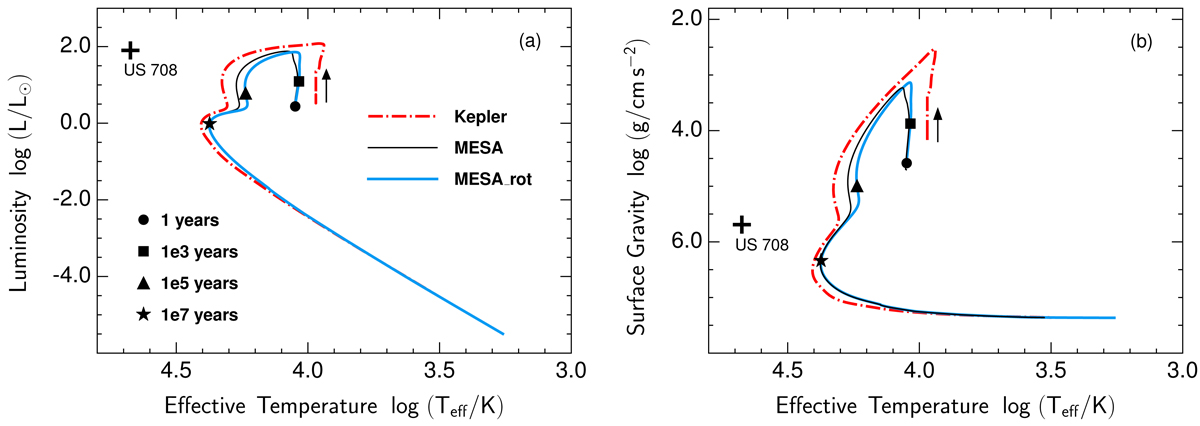
Post-impact evolutionary tracks of a surviving He-star companion model in the H-R diagram (left panel) and surface gravity vs. temperature diagram (right panel). The solid lines and dash-dotted lines respectively correspond to the results of KEPLER and MESA calculations. The filled circle, square, triangle, and star markers on the tracks represent post-impact evolutionary phases of 1 yr, 1 kyr, 100 kyr, and 10 Myr after the SN impact, respectively. The thin lines and thick lines have the same meaning as those in Fig. 5.
Current usage metrics show cumulative count of Article Views (full-text article views including HTML views, PDF and ePub downloads, according to the available data) and Abstracts Views on Vision4Press platform.
Data correspond to usage on the plateform after 2015. The current usage metrics is available 48-96 hours after online publication and is updated daily on week days.
Initial download of the metrics may take a while.