Fig. 4.
Download original image
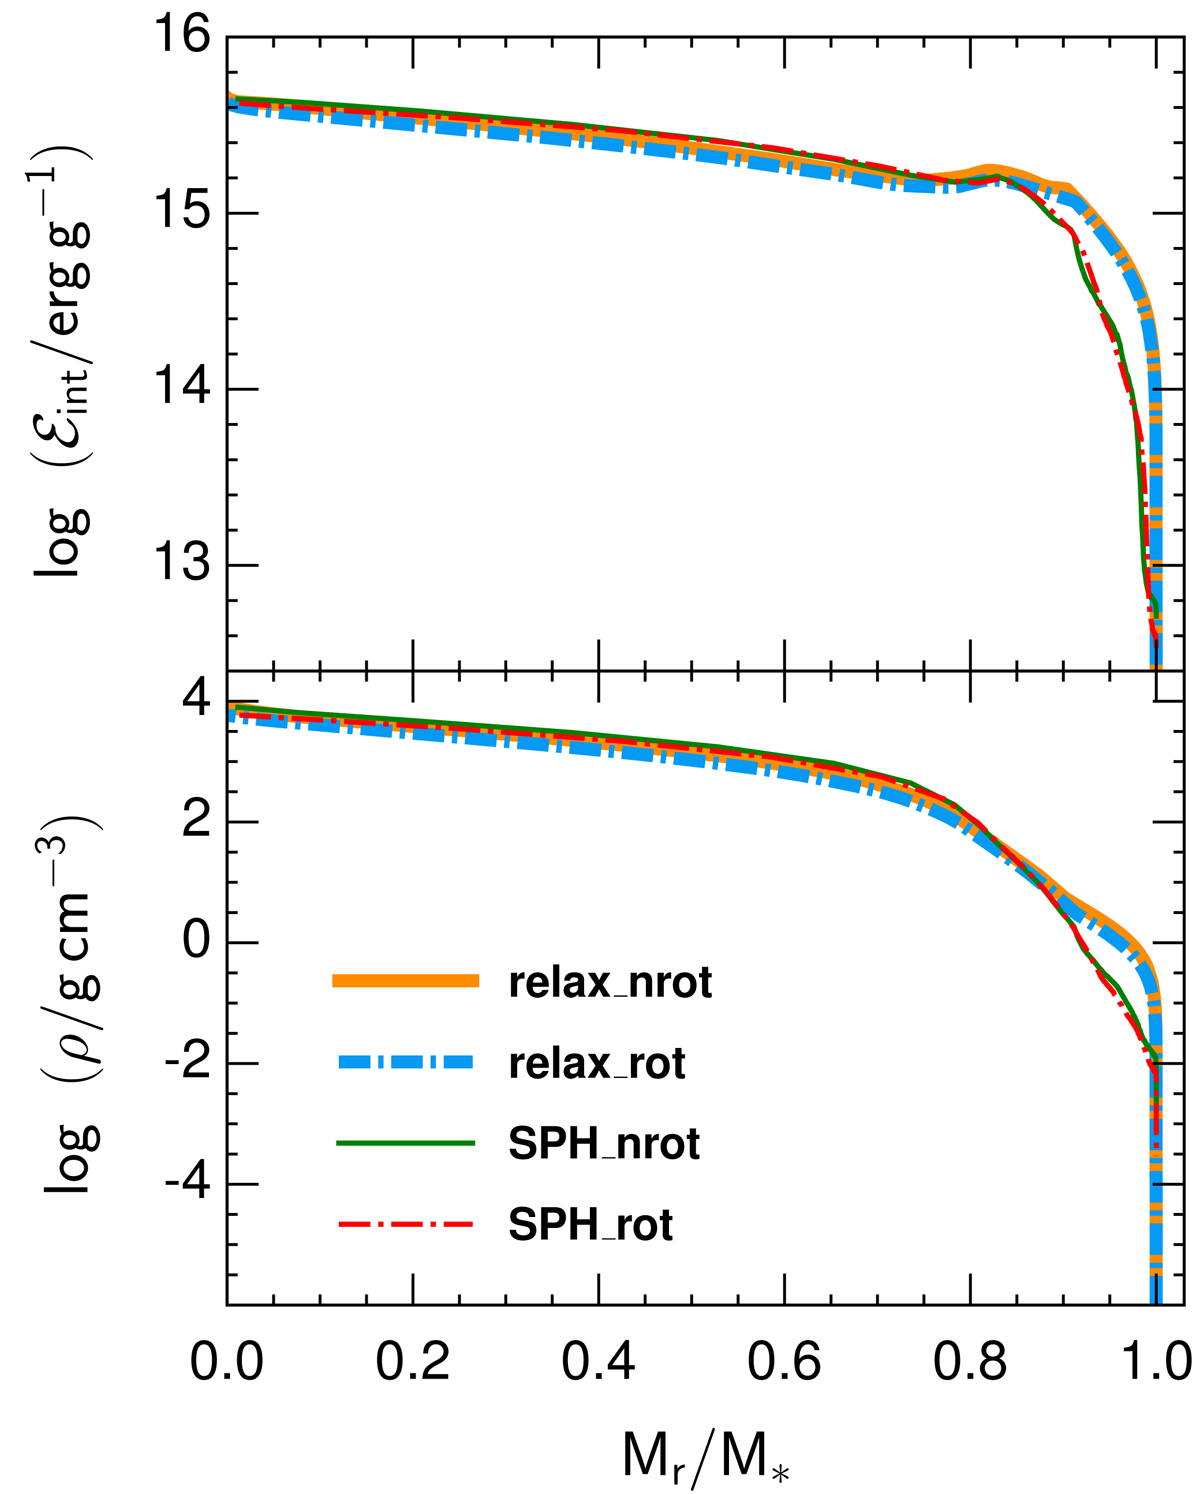
Post-impact 1D angle-averaged profiles (thin lines) of specific internal energy, ℰint (top panel) and density, ρ (bottom panel) as functions of fractional mass coordinates at the end of the SPH impact simulation for our reference model, Model A. For a comparison, the relaxed starting models in MESA are shown as thick lines. The results for the impact simulation with or without binary orbital motion and stellar spin taken into account are shown as dash-dotted lines and solid lines, respectively.
Current usage metrics show cumulative count of Article Views (full-text article views including HTML views, PDF and ePub downloads, according to the available data) and Abstracts Views on Vision4Press platform.
Data correspond to usage on the plateform after 2015. The current usage metrics is available 48-96 hours after online publication and is updated daily on week days.
Initial download of the metrics may take a while.