Fig. 3.
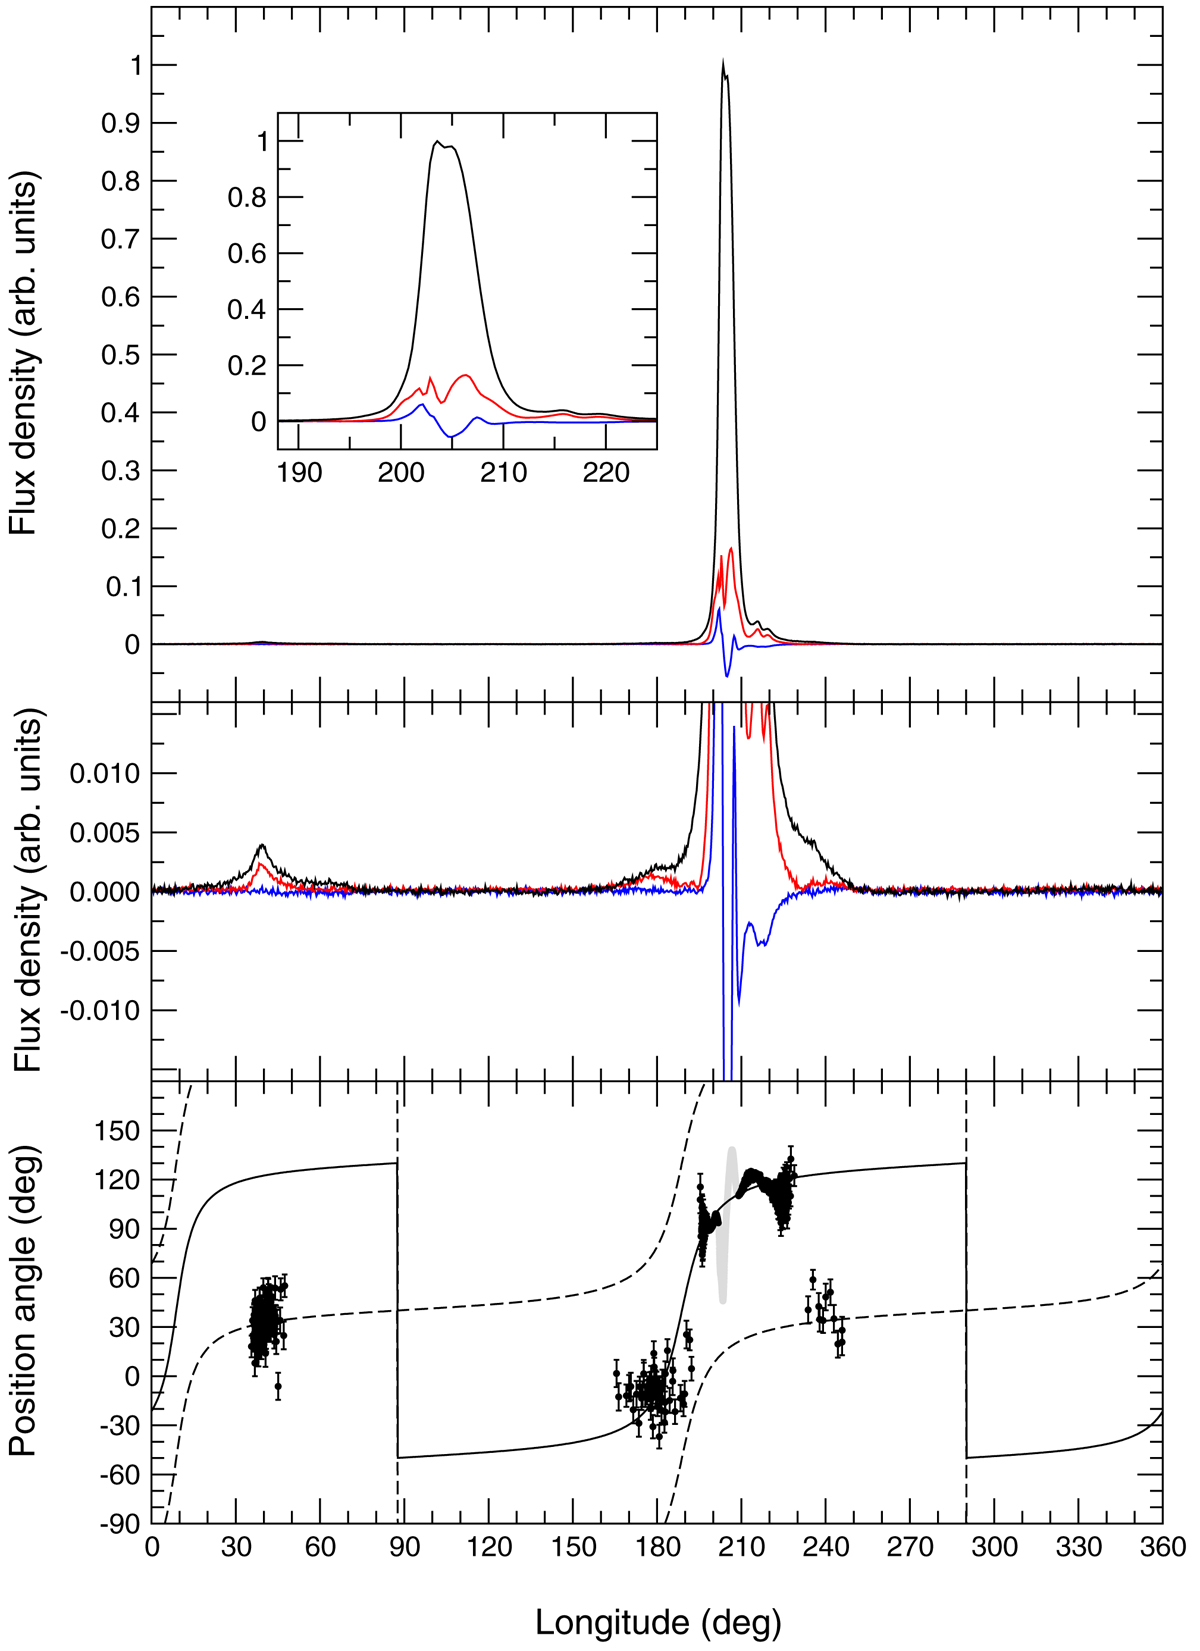
Download original image
Polarisation profile as observed with FAST at a central frequency of 1250 MHz, averaged over a bandwidth of 420 MHz. Top panel: total intensity (black), the linear intensity (red), and circular polarisation (blue) as a function of longitude. The inset shows an enlarged version of the main pulse. Middle panel: low intensity level of the profile across the full rotational period, revealing the existence of an interpulse that is separated from the main pulse by about half a period. Bottom panel: values of the PA of the linear emission as a function of the longitude. An RVM has been fitted to the black PA values. The result is shown as a solid black line, while the dashed line indicates the RVM solution separated by 90 deg.
Current usage metrics show cumulative count of Article Views (full-text article views including HTML views, PDF and ePub downloads, according to the available data) and Abstracts Views on Vision4Press platform.
Data correspond to usage on the plateform after 2015. The current usage metrics is available 48-96 hours after online publication and is updated daily on week days.
Initial download of the metrics may take a while.