Open Access
Fig. B.1.
Download original image
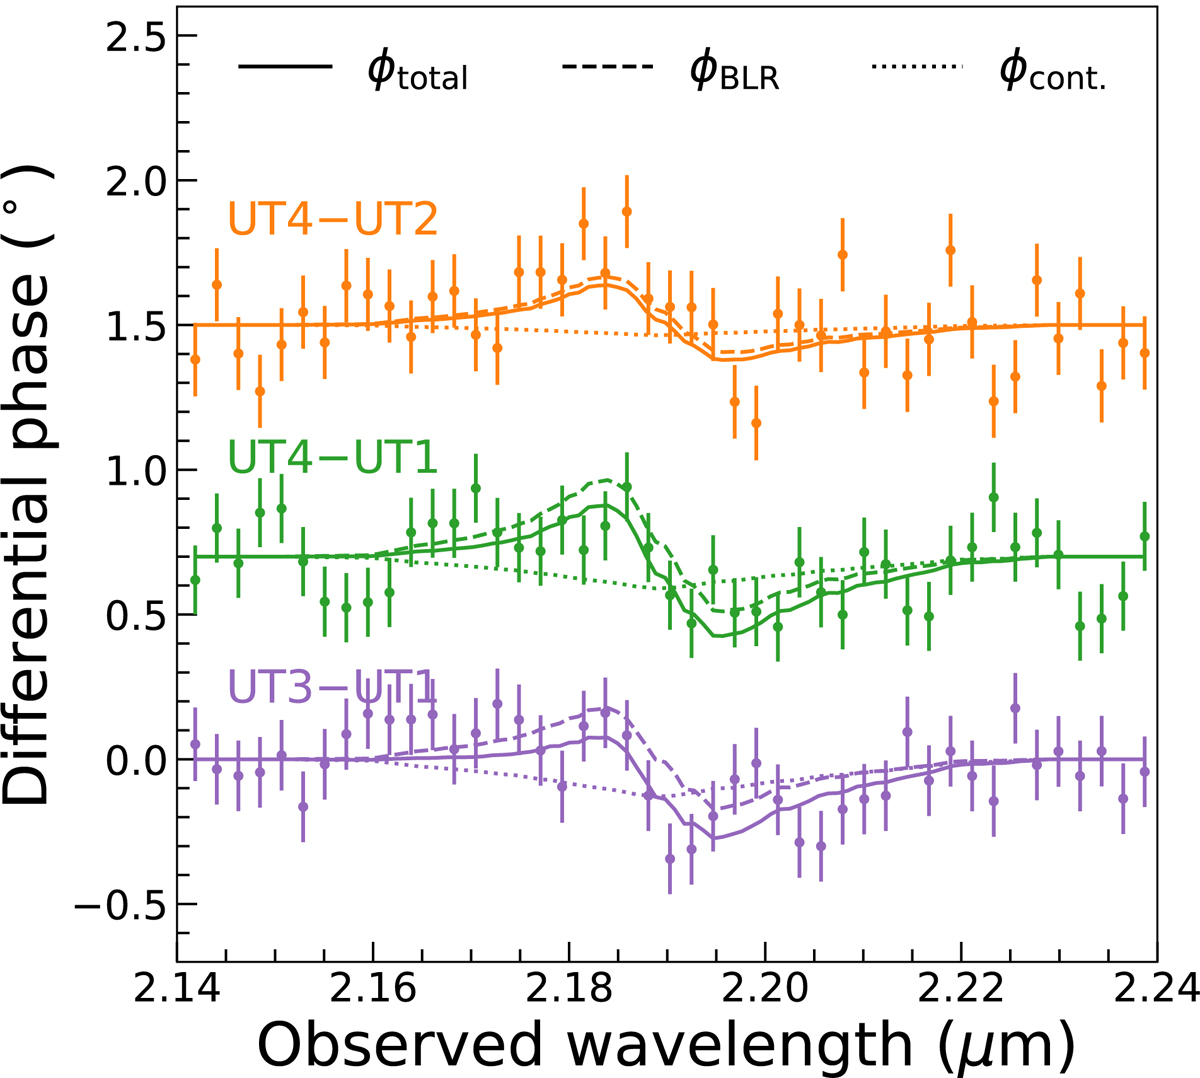
Averaged differential phase data (points) and the best-fit models (lines) of the three baselines that show the strongest signal of the BLR component (dashed lines). The best-fit residual continuum phases are shown with dotted lines.
Current usage metrics show cumulative count of Article Views (full-text article views including HTML views, PDF and ePub downloads, according to the available data) and Abstracts Views on Vision4Press platform.
Data correspond to usage on the plateform after 2015. The current usage metrics is available 48-96 hours after online publication and is updated daily on week days.
Initial download of the metrics may take a while.