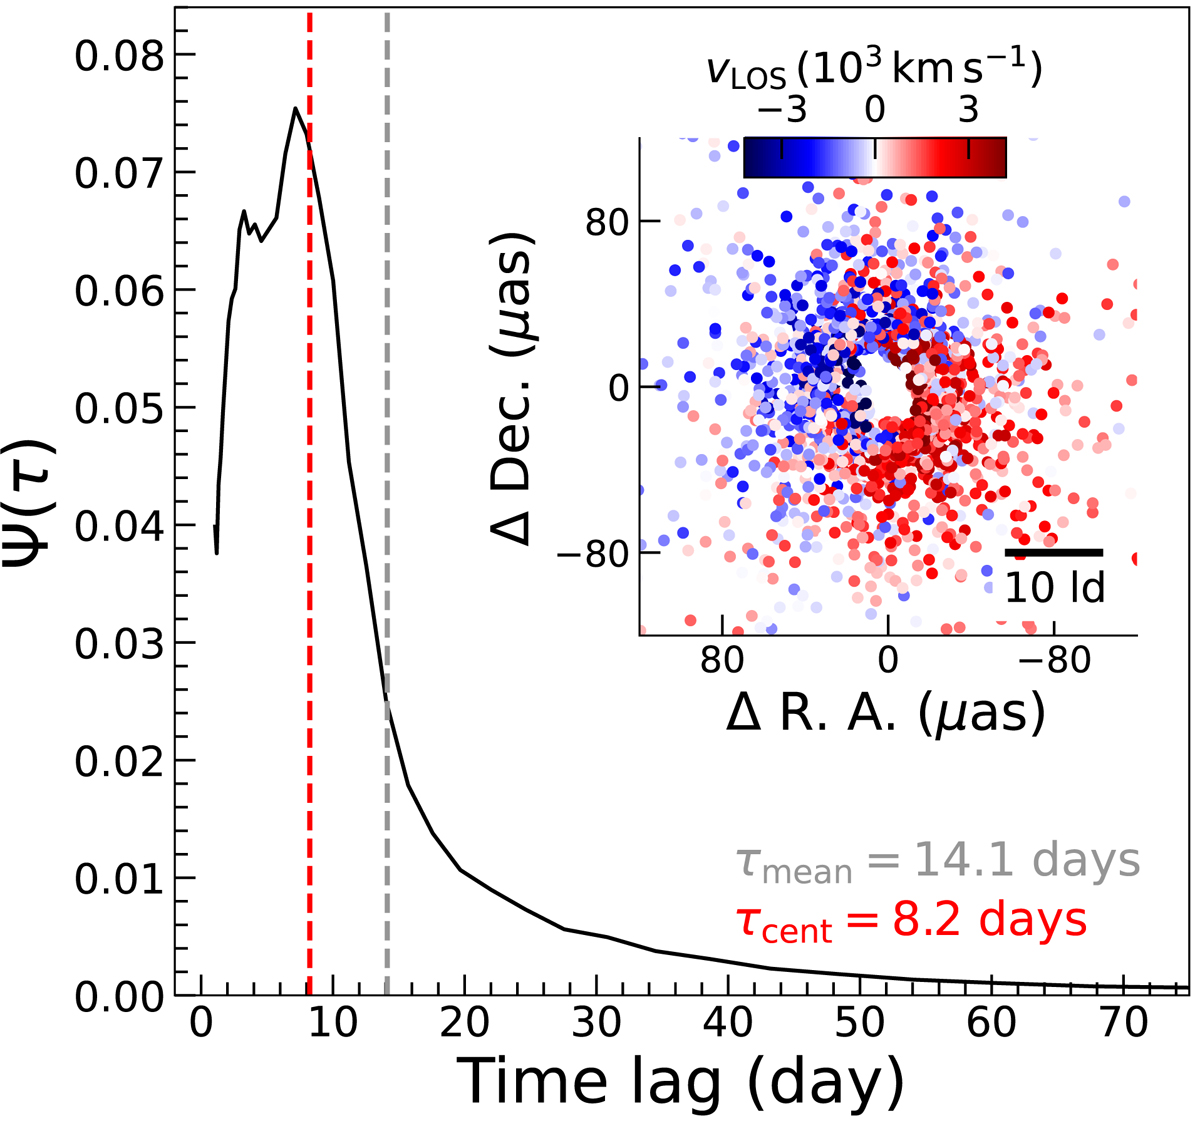
Fig. 4.
Download original image
Transfer function (Eq. (3)) of the best-fit model peaks at the time lag close to τcent, measured from the CCF method. But the mean lag (τmean) is longer because the transfer function has a long tail, which extends beyond the limit of the plot. The inset on the right displays the cloud distribution of the best-fit BLR model. The color code is the light-of-sight velocity.
Current usage metrics show cumulative count of Article Views (full-text article views including HTML views, PDF and ePub downloads, according to the available data) and Abstracts Views on Vision4Press platform.
Data correspond to usage on the plateform after 2015. The current usage metrics is available 48-96 hours after online publication and is updated daily on week days.
Initial download of the metrics may take a while.