Open Access
Fig. 3.
Download original image
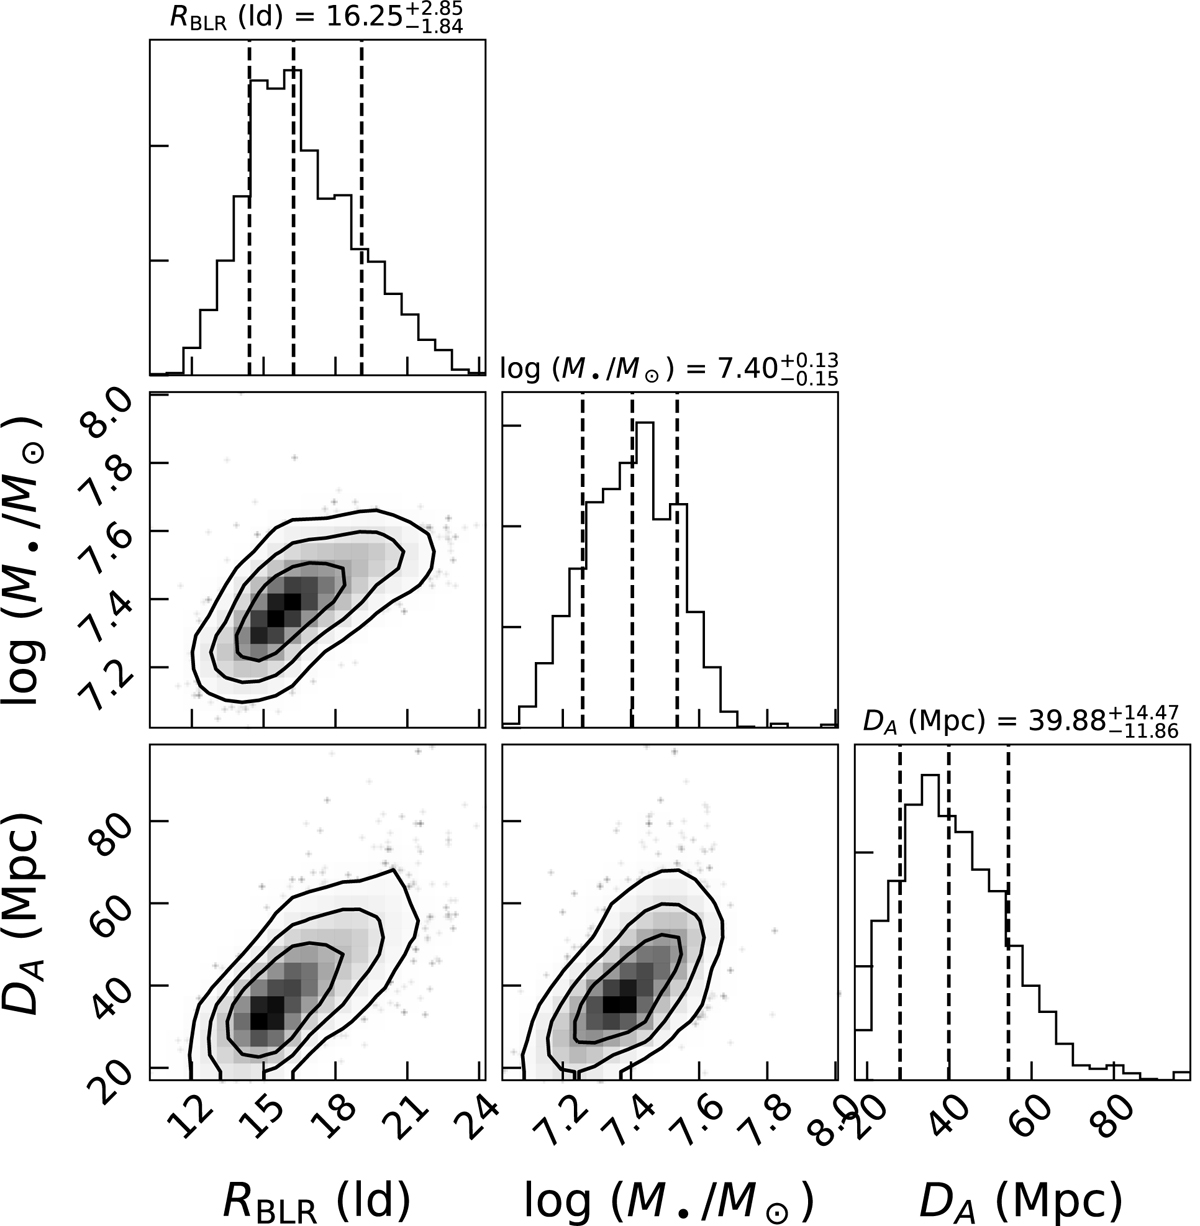
Posterior probability distribution of the BLR radius, BH mass, and angular diameter distance of the joint analysis. The dashed lines indicate the 16%, 50%, and 84% percentiles of the of the posterior distributions. The contours indicate 1σ, 1.5σ, and 2σ.
Current usage metrics show cumulative count of Article Views (full-text article views including HTML views, PDF and ePub downloads, according to the available data) and Abstracts Views on Vision4Press platform.
Data correspond to usage on the plateform after 2015. The current usage metrics is available 48-96 hours after online publication and is updated daily on week days.
Initial download of the metrics may take a while.