Open Access
Fig. 2.
Download original image
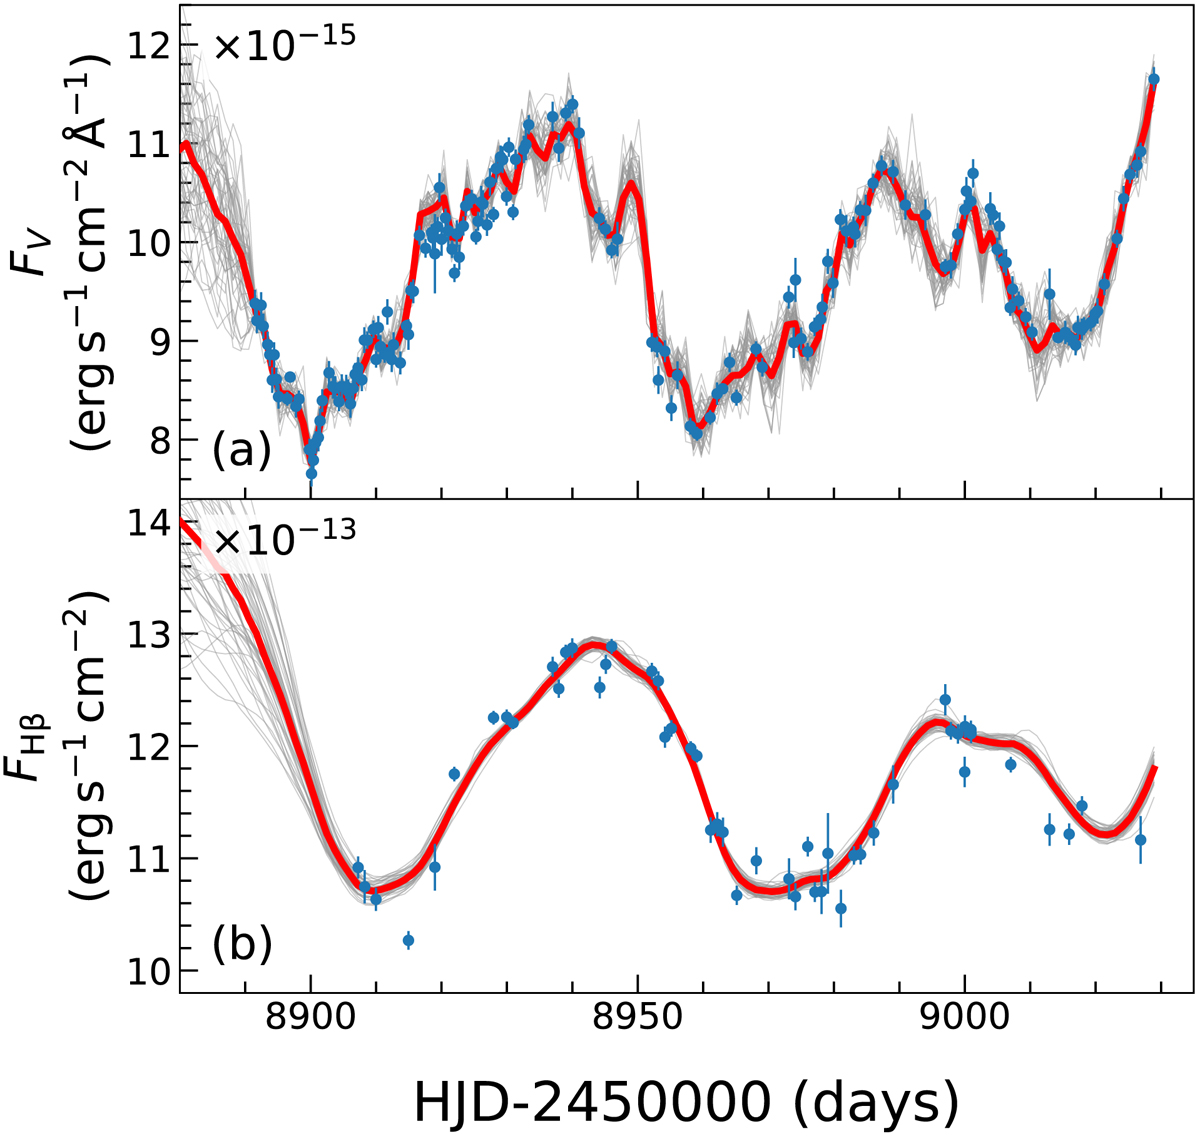
Fitting results of (a) continuum and (b) Hβ light curves. We randomly selected 50 reconstructed continuum light curves and the reverberated Hβ light curves from the posterior sample and display them in gray. The median light curves are in red. The data points are plotted in blue.
Current usage metrics show cumulative count of Article Views (full-text article views including HTML views, PDF and ePub downloads, according to the available data) and Abstracts Views on Vision4Press platform.
Data correspond to usage on the plateform after 2015. The current usage metrics is available 48-96 hours after online publication and is updated daily on week days.
Initial download of the metrics may take a while.