Open Access
Fig. 1.
Download original image
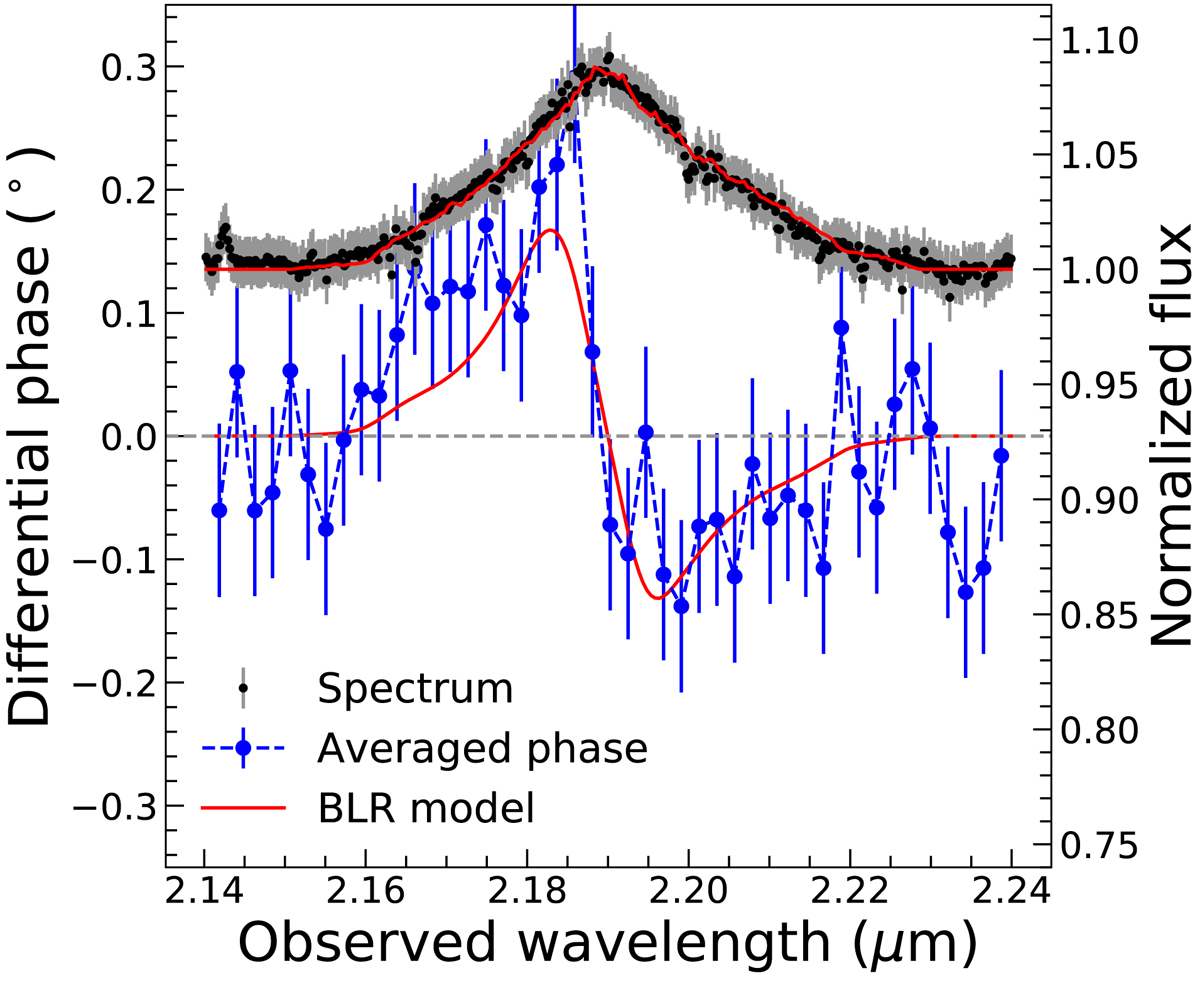
Best-fit line profile and differential phase signal of the BLR are displayed with red curves. The Brγ profile from SINFONI spectrum is in black. The averaged differential phase data of UT4–UT2, UT4–UT1, and UT3-UT1 (see Fig. B.1) with the continuum phase subtracted are displayed in blue.
Current usage metrics show cumulative count of Article Views (full-text article views including HTML views, PDF and ePub downloads, according to the available data) and Abstracts Views on Vision4Press platform.
Data correspond to usage on the plateform after 2015. The current usage metrics is available 48-96 hours after online publication and is updated daily on week days.
Initial download of the metrics may take a while.