Free Access
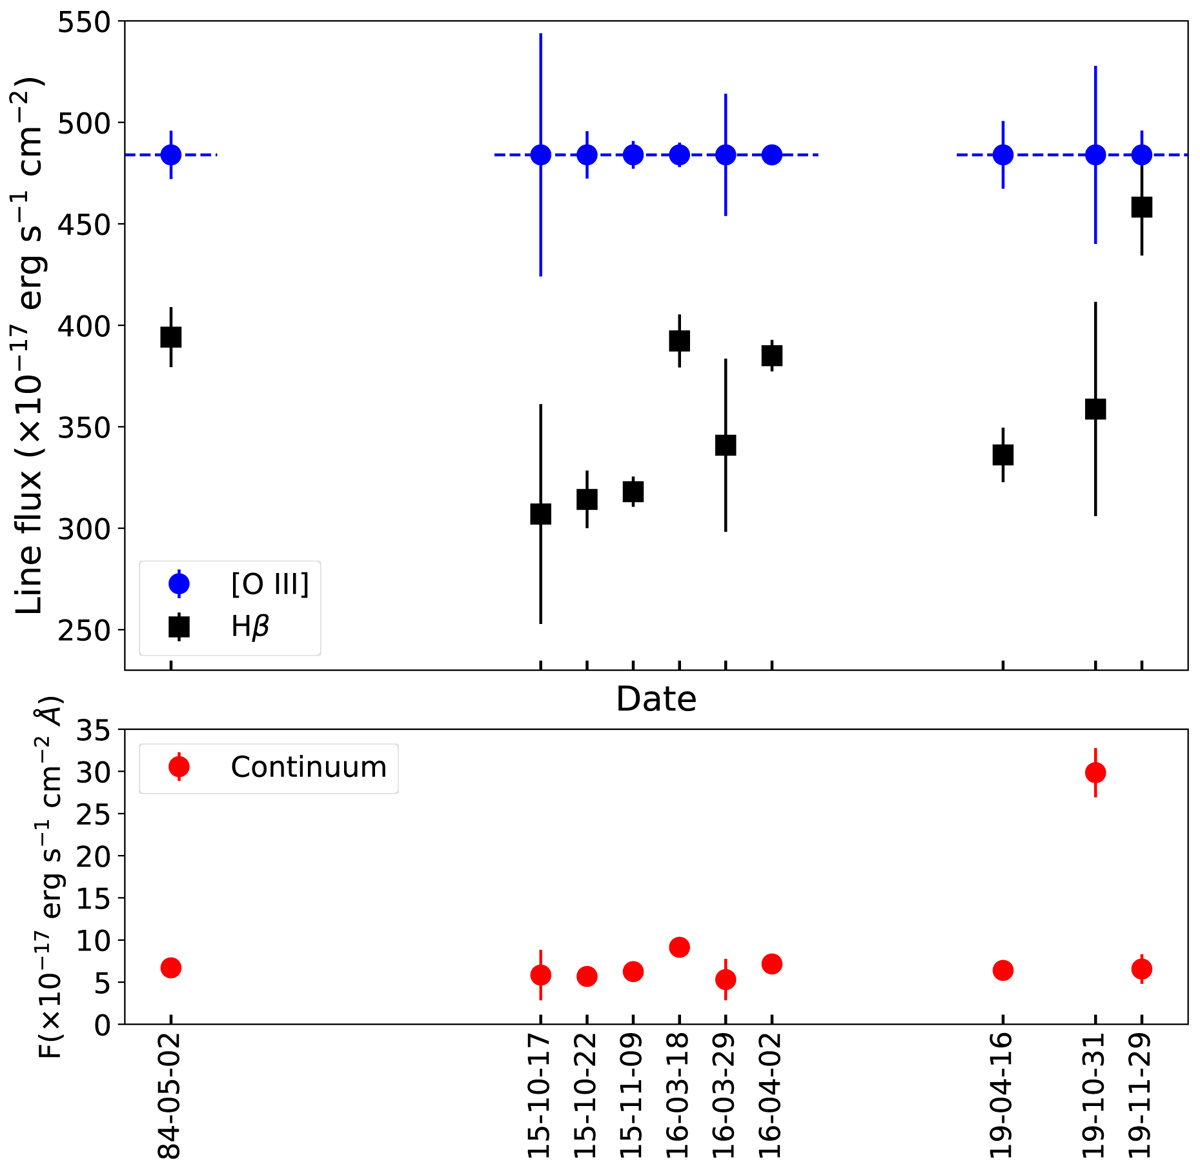
Fig. 6.
Download original image
Variability measured in the continuum flux density and in the Hβ line flux. The blue circles represent the [O III]λ5007 flux, which was forced to be the same in all spectra. The black squares represent the flux of Hβ, and the red circles in the bottom panel represent the continuum flux.
Current usage metrics show cumulative count of Article Views (full-text article views including HTML views, PDF and ePub downloads, according to the available data) and Abstracts Views on Vision4Press platform.
Data correspond to usage on the plateform after 2015. The current usage metrics is available 48-96 hours after online publication and is updated daily on week days.
Initial download of the metrics may take a while.