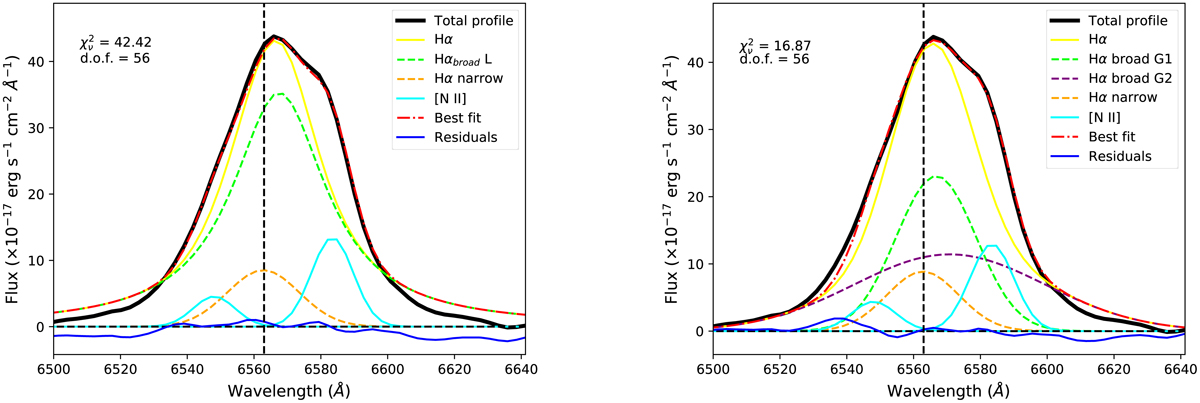
Fig. 5.
Download original image
Fitting of the Hα+[N II] complex. The original spectrum is the solid black line, the residuals of the model subtractions are the solid blue line, the horizontal dashed black line represents the zero level of the continuum, and the vertical dashed line represent the rest-frame wavelength of Hα. Two Gaussians reproduce the two [N II] lines, represented by the solid cyan line, and one Gaussian reproduces the Hα narrow component, indicated by the dashed orange line. The solid yellow line is the actual Hα profile, while the best fit is indicated by the dot-dashed red line. Left panel: broad component of Hα is reproduced with one Lorentzian function, reproduced by the dashed green line. Right panel: broad component of Hα is reproduced with two Gaussians, indicated by the dashed green and purple lines.
Current usage metrics show cumulative count of Article Views (full-text article views including HTML views, PDF and ePub downloads, according to the available data) and Abstracts Views on Vision4Press platform.
Data correspond to usage on the plateform after 2015. The current usage metrics is available 48-96 hours after online publication and is updated daily on week days.
Initial download of the metrics may take a while.