Fig. 4.
Download original image
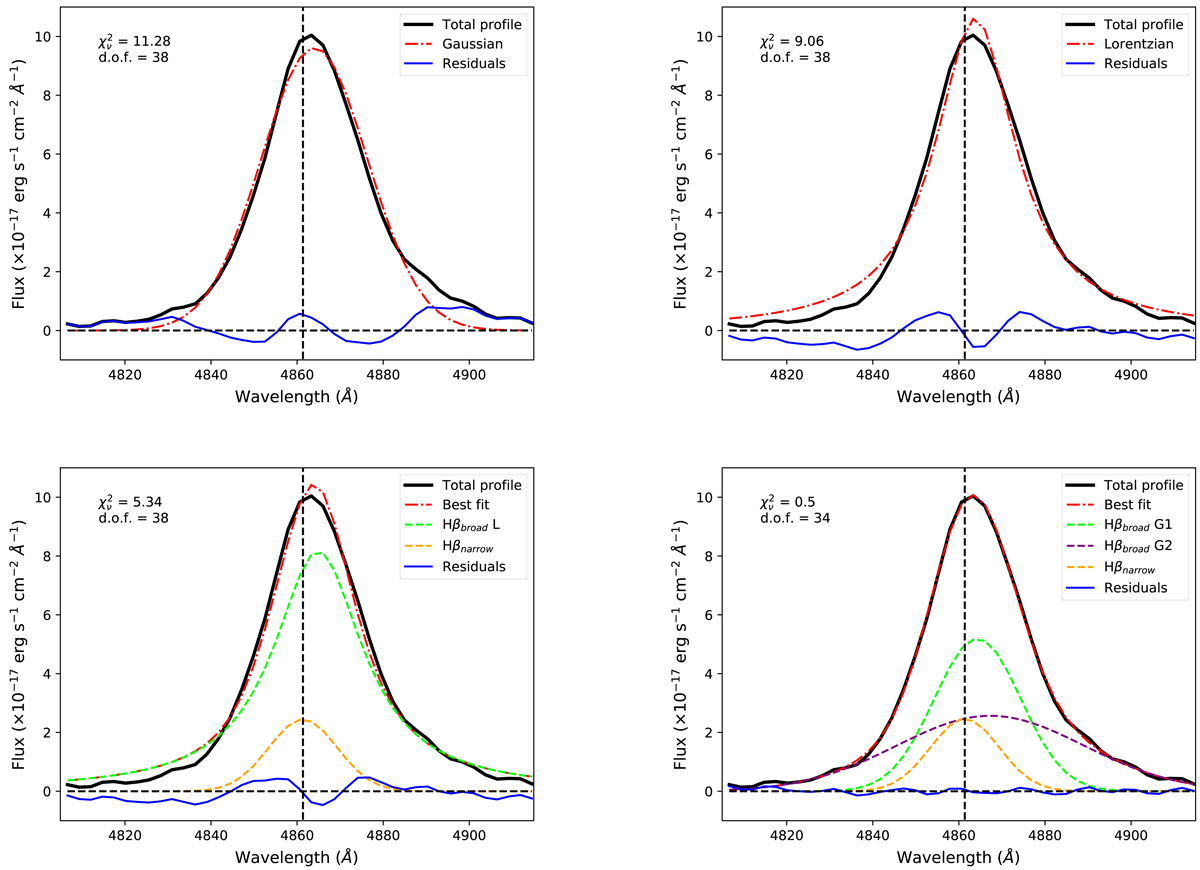
Fit of the Hβ line with different functions. The original spectrum is the solid black line, the residuals of the model subtractions are the solid blue line, the horizontal dashed black line represents the zero level of continuum, and the vertical dashed line represents the rest-frame wavelength of Hβ. The values of ![]() and d.o.f. for each fit are shown in the top left corner of each figure. Top left: fit with a single Gaussian function, represented by the red dot-dashed line. Top right: fit with a single Lorentzian function, indicated by the dot-dashed red line. Bottom left: fit with a Lorentzian function, indicated by the dashed green line, and a narrow Gaussian function, represented by the dashed orange line. The best fit is indicated by the dot-dashed red line. Bottom right: fit with three Gaussian functions, indicated by the dashed green, purple, and orange lines. The narrow component is the orange function. The best fit is indicated by the dot-dashed red line.
and d.o.f. for each fit are shown in the top left corner of each figure. Top left: fit with a single Gaussian function, represented by the red dot-dashed line. Top right: fit with a single Lorentzian function, indicated by the dot-dashed red line. Bottom left: fit with a Lorentzian function, indicated by the dashed green line, and a narrow Gaussian function, represented by the dashed orange line. The best fit is indicated by the dot-dashed red line. Bottom right: fit with three Gaussian functions, indicated by the dashed green, purple, and orange lines. The narrow component is the orange function. The best fit is indicated by the dot-dashed red line.
Current usage metrics show cumulative count of Article Views (full-text article views including HTML views, PDF and ePub downloads, according to the available data) and Abstracts Views on Vision4Press platform.
Data correspond to usage on the plateform after 2015. The current usage metrics is available 48-96 hours after online publication and is updated daily on week days.
Initial download of the metrics may take a while.