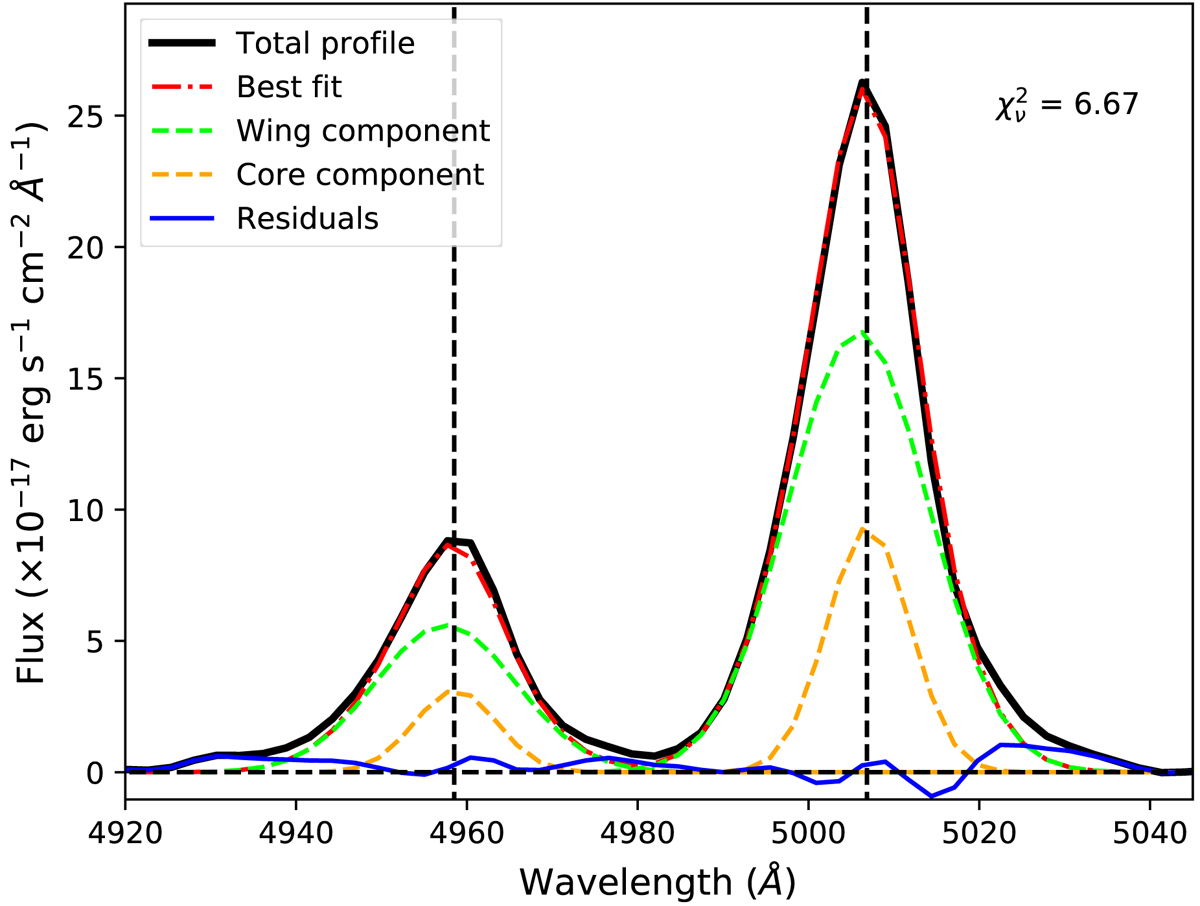
Fig. 3.
Download original image
Fit of the [O III] lines after continuum and Fe II subtraction. The spectrum is represented by the solid black line. The two Gaussian components represent the line core (dashed orange line) and wing (dashed green line). The best fit is represented by the dot-dashed red line, the residuals by the solid blue line, and the horizontal dashed line represents the zero level of the continuum. The rest-frame wavelength of the two lines is indicated by the vertical dashed lines. Due to the low spectral resolution, the core component is unresolved.
Current usage metrics show cumulative count of Article Views (full-text article views including HTML views, PDF and ePub downloads, according to the available data) and Abstracts Views on Vision4Press platform.
Data correspond to usage on the plateform after 2015. The current usage metrics is available 48-96 hours after online publication and is updated daily on week days.
Initial download of the metrics may take a while.