Free Access
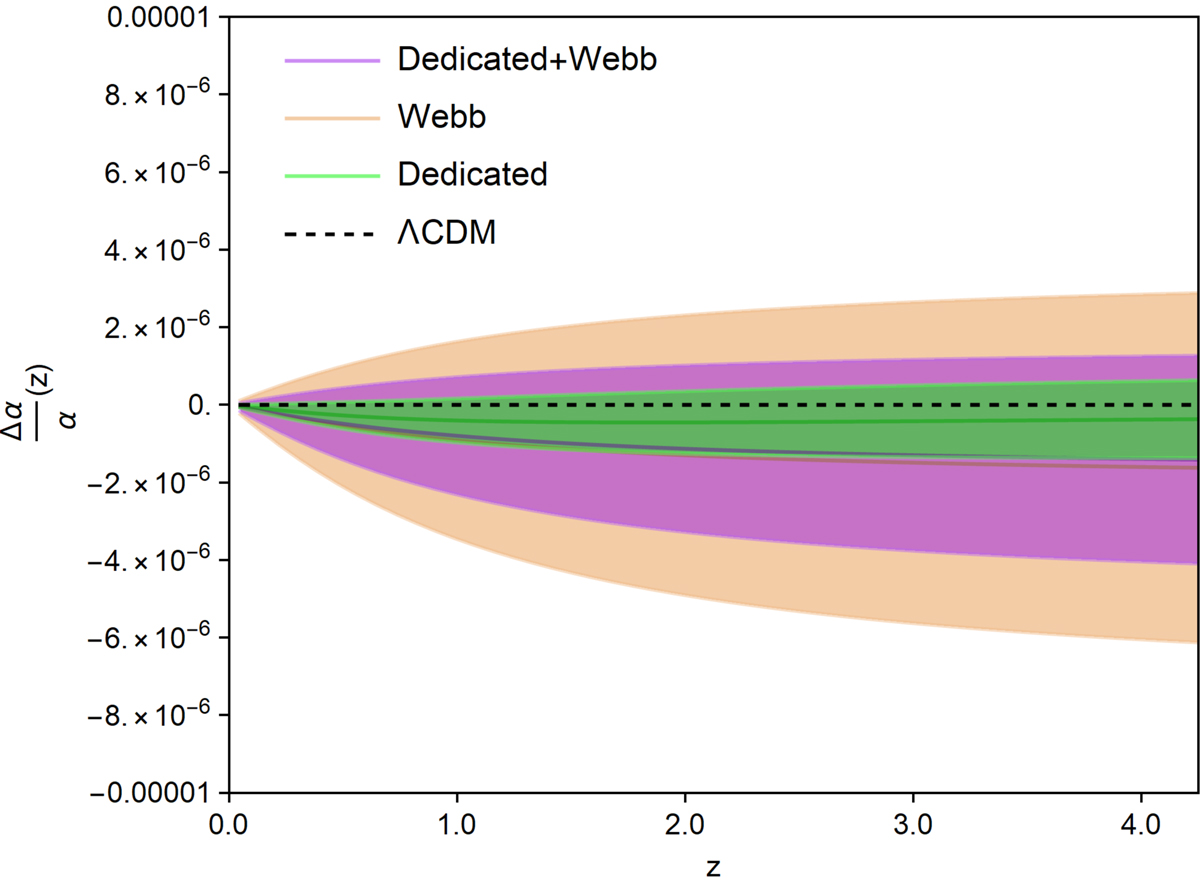
Fig. A.1.
Download original image
GA reconstruction of the relative variation in the fine-structure constant Δα/α as a function of redshift. The green line corresponds to the dedicated measurements, the orange line to the Webb archival data and the magenta line to the combination of the two, while in all cases the shaded region is the 1σ error.
Current usage metrics show cumulative count of Article Views (full-text article views including HTML views, PDF and ePub downloads, according to the available data) and Abstracts Views on Vision4Press platform.
Data correspond to usage on the plateform after 2015. The current usage metrics is available 48-96 hours after online publication and is updated daily on week days.
Initial download of the metrics may take a while.