Fig. 7.
Download original image
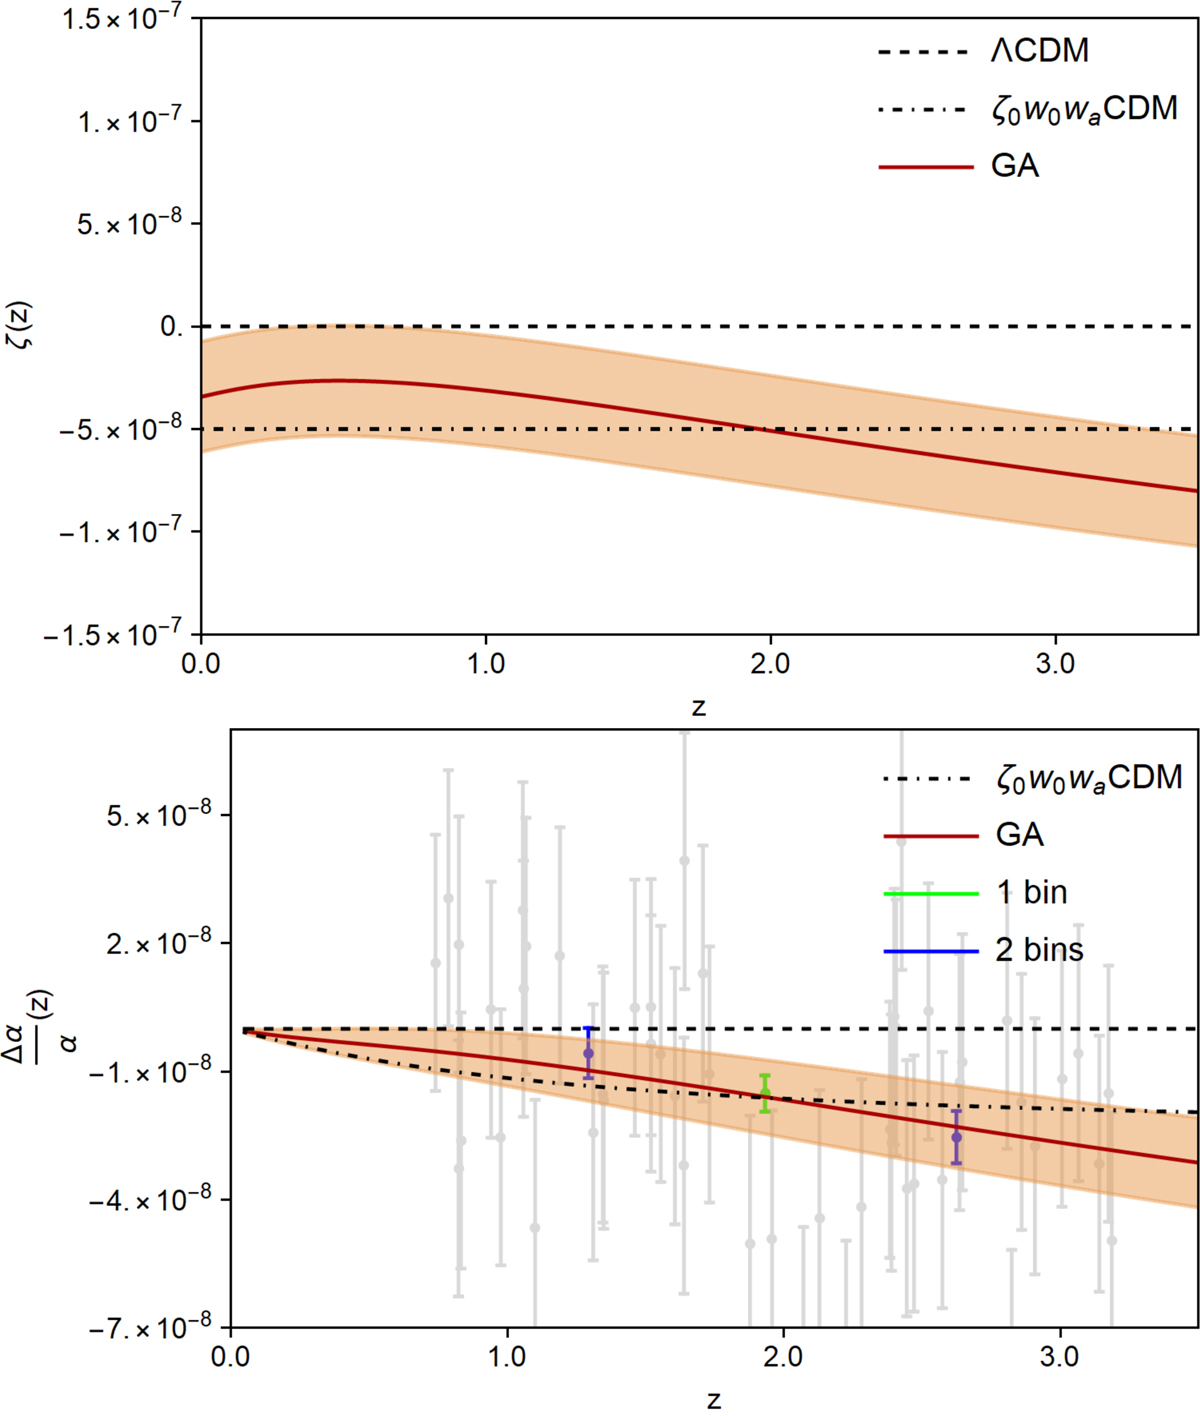
Top panel: GA reconstruction of the coupling ζ as a function of redshift (red line) using the forecast ELT α data (grey background points), the atomic clocks constraints and the MICROSCOPE bound (both at z = 0) and Euclid forecast constraints with a ζw0waCDM fiducial. Bottom panel: reconstruction of the relative variation in the fine-structure constant Δα/α (red line) along with binned values of the data in one (green point) and two bins (blue points). In both cases the red line corresponds to the GA reconstruction, while the shaded region is the 1σ error.
Current usage metrics show cumulative count of Article Views (full-text article views including HTML views, PDF and ePub downloads, according to the available data) and Abstracts Views on Vision4Press platform.
Data correspond to usage on the plateform after 2015. The current usage metrics is available 48-96 hours after online publication and is updated daily on week days.
Initial download of the metrics may take a while.