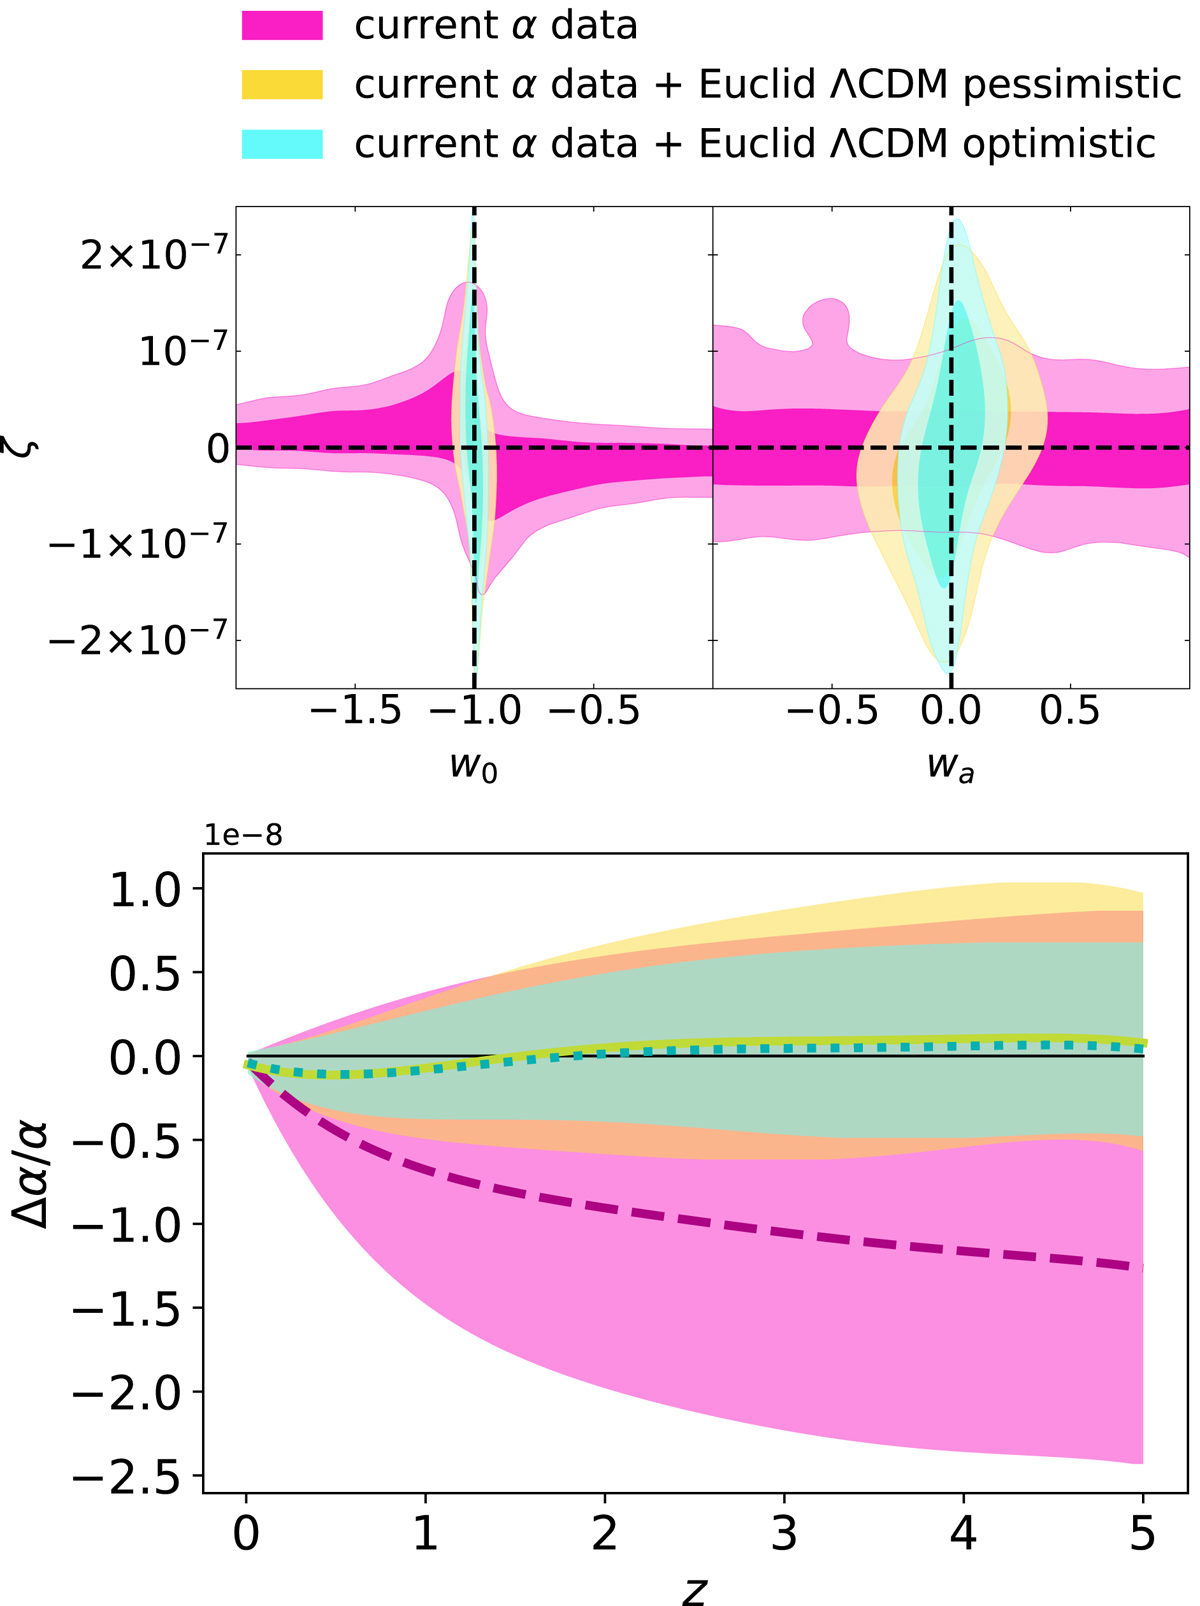
Fig. 2.
Download original image
Top panel: constraints on the CPL and coupling parameters using currently available data for α measurements alone (purple contours) and in combination with Euclid forecast constraints with a ΛCDM fiducial (yellow contours for the pessimistic case and cyan contours for the optimistic case). Bottom panel: reconstruction of the mean trend in redshift of Δα/α and of the allowed 68% confidence level area, obtained interpolating the marginalized means and errors of the derived parameters described in Sect. 4. The purple dashed line and purple area refer to α measurements alone, the yellow solid line and yellow area include Euclid in the pessimistic case, while the dotted green line and green contours combine the optimistic case.
Current usage metrics show cumulative count of Article Views (full-text article views including HTML views, PDF and ePub downloads, according to the available data) and Abstracts Views on Vision4Press platform.
Data correspond to usage on the plateform after 2015. The current usage metrics is available 48-96 hours after online publication and is updated daily on week days.
Initial download of the metrics may take a while.