Fig. C.1
Download original image
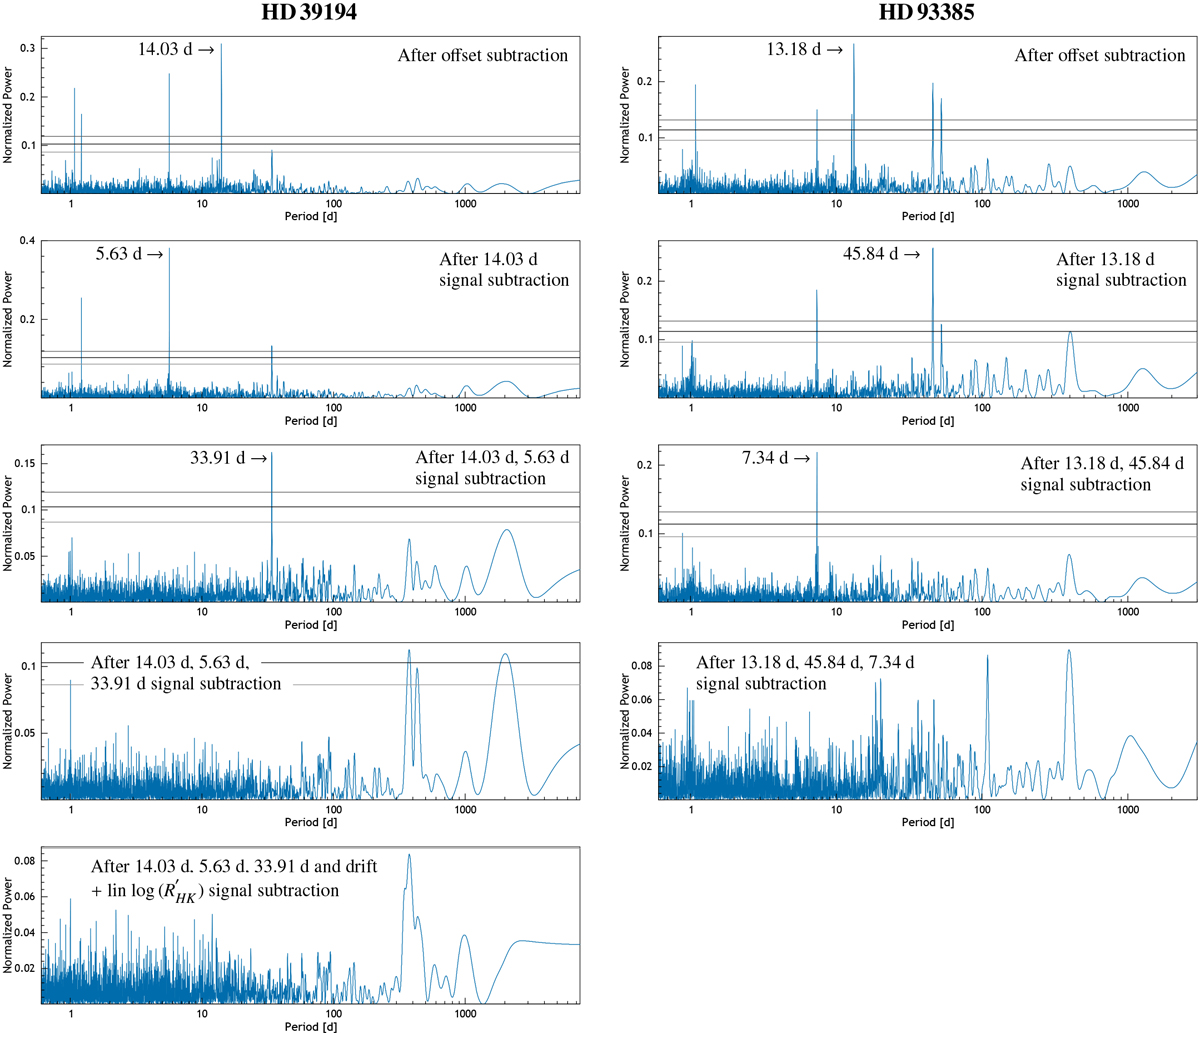
Left: Periodogram of the RV residuals of HD39194, after sequentially removing, from top to bottom, the instrumental RV offsets (free parameters), the 14.03 d (resp. 5.63 d and 33.91 d) Keplerian signals and a third-order drift plus a linear term with
![]() . Right: Periodogram of the RV residuals of HD93385, after sequentially removing, from top to bottom, the instrumental RV offsets (free parameters), the 13.18 d (resp. 45.84 d and 7.34 d) Keplerian signals. False alarm probability (FAP) thresholds are shown as horizontal lines for FAP=10%, 1% and 0.1%.
. Right: Periodogram of the RV residuals of HD93385, after sequentially removing, from top to bottom, the instrumental RV offsets (free parameters), the 13.18 d (resp. 45.84 d and 7.34 d) Keplerian signals. False alarm probability (FAP) thresholds are shown as horizontal lines for FAP=10%, 1% and 0.1%.
Current usage metrics show cumulative count of Article Views (full-text article views including HTML views, PDF and ePub downloads, according to the available data) and Abstracts Views on Vision4Press platform.
Data correspond to usage on the plateform after 2015. The current usage metrics is available 48-96 hours after online publication and is updated daily on week days.
Initial download of the metrics may take a while.