Fig. 1
Download original image
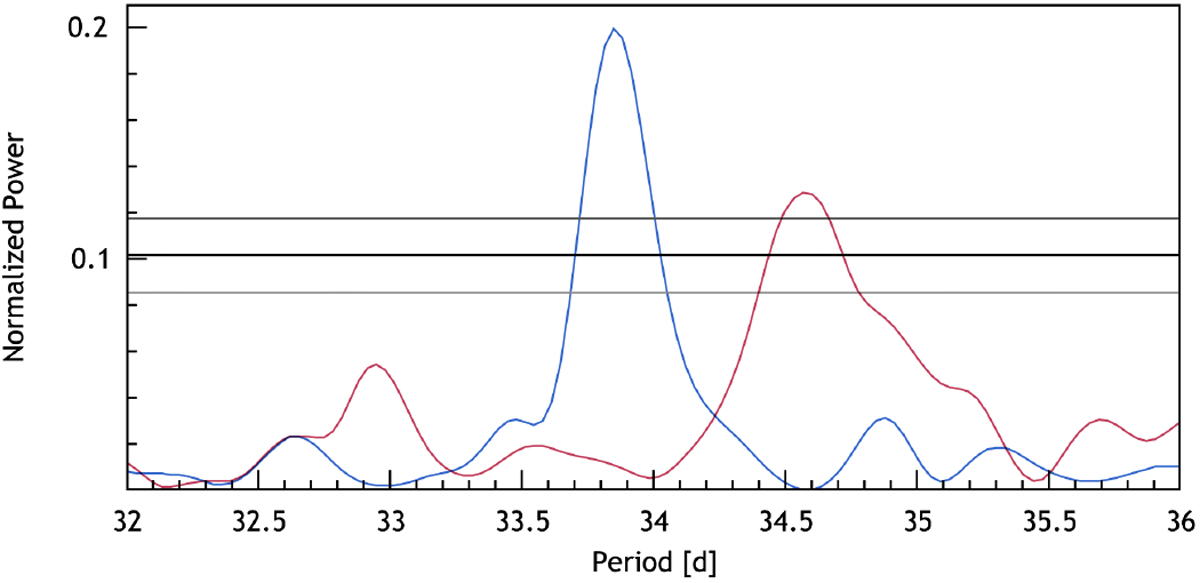
Periodogram of the activity indicator Hα (in red), after removing a long term drift of ~8000 days, together with the periodogram of the residuals of the RV time-series (in blue) after removing the 14 and 5 day signals. We can see that both peaks are independent. False alarm probability (FAP) thresholds are shown as horizontal lines for FAP = 10, 1 and 0.1%.
Current usage metrics show cumulative count of Article Views (full-text article views including HTML views, PDF and ePub downloads, according to the available data) and Abstracts Views on Vision4Press platform.
Data correspond to usage on the plateform after 2015. The current usage metrics is available 48-96 hours after online publication and is updated daily on week days.
Initial download of the metrics may take a while.