Fig. 6.
Download original image
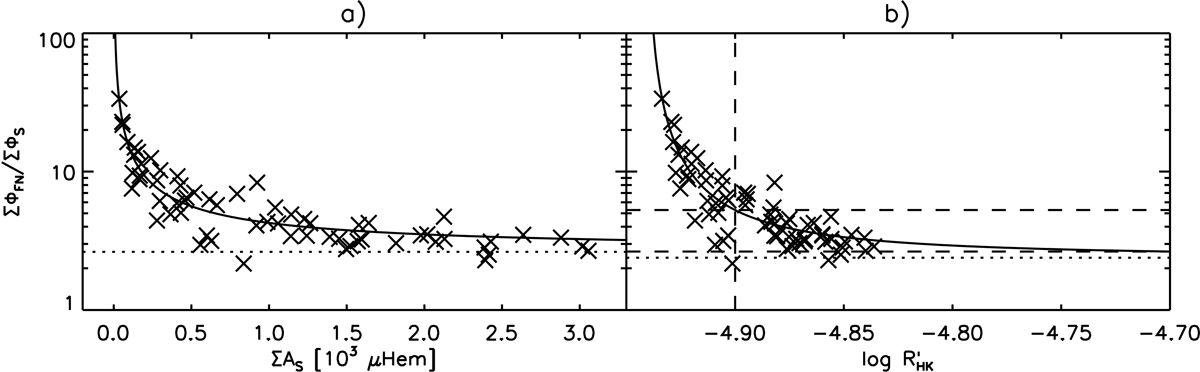
Variation in the balance between bright faculae and network and dark sunspots with solar activity. (a) The ratio ![]() , where ΣΦFN is obtained from the CJSS-YEA run, as a function of ΣAS (crosses). As in Fig. 5, the annual mean over the period of 1924 to 1986 is depicted. The solid line follows the power-law fit (Eq. (22)) and the dotted line gives the position of the horizontal asymptote as given by the constant term in this fit. (b) The same, but for
, where ΣΦFN is obtained from the CJSS-YEA run, as a function of ΣAS (crosses). As in Fig. 5, the annual mean over the period of 1924 to 1986 is depicted. The solid line follows the power-law fit (Eq. (22)) and the dotted line gives the position of the horizontal asymptote as given by the constant term in this fit. (b) The same, but for ![]() as a function of
as a function of ![]() . The vertical dashed line indicates
. The vertical dashed line indicates ![]() and the horizontal dashed lines gives the value of
and the horizontal dashed lines gives the value of ![]() at
at ![]() and
and ![]() , as given by the power-law fit (Eq. (23)) (see Sect. 4 for details).
, as given by the power-law fit (Eq. (23)) (see Sect. 4 for details).
Current usage metrics show cumulative count of Article Views (full-text article views including HTML views, PDF and ePub downloads, according to the available data) and Abstracts Views on Vision4Press platform.
Data correspond to usage on the plateform after 2015. The current usage metrics is available 48-96 hours after online publication and is updated daily on week days.
Initial download of the metrics may take a while.