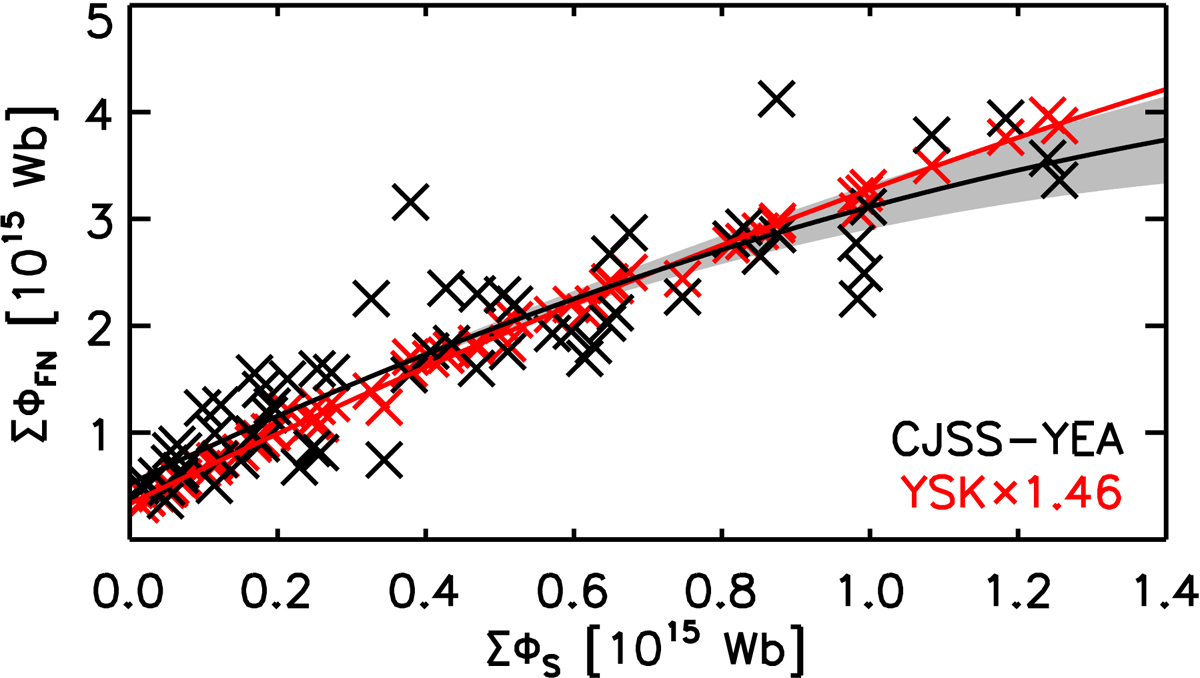
Fig. 5.
Download original image
Disc-integrated facular and network magnetic flux, ΣΦFN, as indicated by the CJSS-YEA run (black crosses) and by the YSK model (red crosses), as a function of the disc-integrated sunspot magnetic flux, ΣΦS. The first solar cycle in the CJSS-YEA run (cycle 15, 1913 to 1923) has been excluded as the simulation is sensitive to the arbitrary initial condition here. The annual mean over the period of 1924 to 1986, where there is data from both models, is shown. The black line and the grey region represents the quadratic polynomial fit to the CJSS-YEA run values and the corresponding 95% confidence interval, while the red line represents the fit to the YSK model values. See Sect. 4 for details.
Current usage metrics show cumulative count of Article Views (full-text article views including HTML views, PDF and ePub downloads, according to the available data) and Abstracts Views on Vision4Press platform.
Data correspond to usage on the plateform after 2015. The current usage metrics is available 48-96 hours after online publication and is updated daily on week days.
Initial download of the metrics may take a while.